Menu
Menu
Your Cart
Drouot Live Catalog and live bidding at Drouot Live
Inter Encheres Catalog and live bidding at Interencheres

ADER - Auction of geological maps and atlases, 16 December 2025

Atlas / Worldmap  |  Africae |  America  |  Canada  |  Antilles  |  Colombia  | Asie  |  Australie  |  Europe  |  France

Atlas

23
BERGHAUS / STIELER.

Berghaus Physical Atlas, Stielers Hand-Atlas… [lot de 4 atlas].

geological map
1892-1905. x mm.Lot of 4 folio atlases, some incomplete. Bindings worn. Sold as is.

Four German atlases, including Berghaus’s Physical Atlas and Stieler’s Hand-Atlas.

200 - 300 €

Continents

24
THOULET, Julien / TOLLEMER, Alphonse.

Carte générale bathymétrique des océans dressée par ordre de S.A.S. le prince de Monaco.

geological map
Monaco, ca. 1937. 720 x 1130 mm.Sheet [1]: Title and general legend, Sheet [2]: index map, plus 26 sheets labeled A, A’, B, B’, C, and C’. Map size: 72 × 113 cm. Some maps split along the center fold and torn at the edges.

Set of bathymetric maps of the oceans (complete in 26 sheets) from various editions produced under the direction of M. Ch. Sauerwein by M. Tollemer. Compiled by order of H.S.H. Prince Albert I of Monaco (1848–1922). Depths are shown by color shading and bathymetric soundings in meters. The project for the General Bathymetric Chart of the Oceans (often abbreviated as Bathymetric Chart of the Oceans) was presented in 1904 and adopted at the International Geographical Congress in Washington on September 8, 1904. The first edition served as the foundation for later editions (second, third, fourth, etc.), which progressively improved methods of sounding, cartography, and projection.

500 - 800 €

Mappemondes

25
DU PETIT-THOUARS, Abel Aubert.

Carte Générale du Globe pour servir au voyage de circumnavigation de la Frégate La Vénus. Avec : DUFOUR, A. H. Planisphère Terrestre.

geological map
Paris, Gide. / Paris, Andriveau-Goujon, 1848. x mm.Two maps :"Carte Générale du Globe…" : 58 × 85.5 cm. Paper creased, tears along the margins. DUFOUR, "Planisphère Terrestre" : mounted on linen, 61 × 86.5 cm.

Separate issue. Double-page engraved chart, with contemporary hand-colour in full, frayed at the edges. A separately issued example. Subsequently published in the official account of Petit-Thouars 'Voyage Autour du Monde sur la Fregate la Venus pendant les annees 1836-1839' (1840-1843). The voyage, "ostensibly to report on the whale fisheries in the Pacific, was actually primarily political in nature. The presence of the frigate 'Venus' in ports around the world would be of value to French commerce and diplomacy. Du Petit-Thouars's account of his 1837 stay in California is one of the most important and complete records of the Mexican period in California. After visits to Sydney and Mauritius, the ship sailed home, arriving after a voyage of thirty months" (Hill). Abel Aubert du Petit-Thouars (1793-1864) was the nephew of the French botanist Louis du Petit-Thouars (1758-1831). He is credited with bringing the Marquesas and Society Islands under French protection. He rose to the rank of vice-admiral in 1846. Joined : DUFOUR. Planisphère Terrestre. (61 x 99 cm).

300 - 500 €

Mappemondes

26
GROLL, Max.

Der Atlantische Ozean / der Stille Ozean / der Indische Ozean.

geological map
Berlin, 1912. 1120 x 920 mm.Three folio chromolithographed maps of which 2 double sheet maps.

Three bathymetric maps depicting the Atlantic, Pacific, and Indian Oceans, prepared by Max Groll at the Institute of Oceanography, University of Berlin, at a scale of 1:40,000,000. Max Groll attended the secondary Wagnerschool in Leipzig-Reudnitz and then trained as a design manufacturer at the Wagner & Debes geographical institute in Leipzig from 1892 to 1896. From 1896 to 1898 he was an employee of the Russian edition of the great hand centre of Ernst Debes, of the publishing house Adolf Fyodorovich Marks in St. Petersburg. From 1899, Groll worked in Switzerland with Kümmerly+Frey in Bern, where he also held a university degree in Bern, which he continued at the University of Vienna and the Friedrich Wilhelm University of Berlin. After Ferdinand von Richthofen had brought him to the Institute and Museum of Marine Science in the Department of Geographical Sciences as a cartographer in 1902, he also took on teaching duties from 1903 and, after his doctorate in 1904 in Bern, he also worked as an editor for cartography at the Friedrich Wilhelm University of Berlin from 1907 onwards, which is now considered a decisive milestone for the beginning of modern cartographic university.

300 - 500 €

Egypte

27
Société d'études historiques et géographiques de l'isthme de Suez.

Société des études de l'Isthme de Suez. Travaux de la brigade française, 1847.

geological map
1847. x mm.Five large lithographed maps, including one large map (detached from the volume) measuring 88 x 130 cm, and four maps measuring 70 x 104 cm. Tears and losses. Paper weakened.

Set of 5 large lithographed maps produced by the Société des Études de l’Isthme de Suez at a scale of 1:225,000.

300 - 500 €

Afrique australe

28
ROGERS, A. W.

Physical map of the Union of South Africa - Fiesiese Kaart van die Unie van Suid-Afrika.

geological map
Pretoria, Government Printer, 1931. x mm.Coloured lithographed map printed on four large folio sheets, unjoined. Splits along center fold, a tear of about 10 cm within the map, and weakened margins.

Bilingual English/Afrikaans physical map of the Union of South Africa, lithographed and published by the Government Printer in Pretoria under the direction of A. W. Rogers and the Geological Survey of the Union of South Africa. The Union of South Africa (Dutch: Unie van Zuid-Afrika; Afrikaans: Unie van Suid-Afrika) was the historical predecessor to the present-day Republic of South Africa. It came into existence on 31 May 1910 with the unification of the Cape, Natal, Transvaal, and Orange River colonies. Arthur W. Rogers, geologist, was the son of George Rogers, a teacher, and his wife Emma Mills. He was educated at a private school and subsequently (1885-1891) at Clifton College, Bristol, where he developed an interest in natural history and geology. From 1891 to 1895, he studied at Christ's College, Cambridge, graduating in 1894 with a Bachelor of Arts (BA) with honours in geology and zoology, and winning the Harkness Scholarship in geology the following year. During his student days, he made a tour of several months through Germany. He learned much about field surveying from George W. Lamplugh*, with whom he visited the Isle of Man while a student.In 1895 Rogers accepted an appointment as assistant geologist to the newly established Geological Commission of the Cape of Good Hope. He brought with him a large collection of rocks from England, which he presented to the South African Museum, Cape Town, in 1899. The Geological Commission of the Cape of Good Hope instituted the first proper geological survey of the Cape Colony, with a view to investigating and mapping its geology. The Commission's geologist was Dr G.S. Corstorphine*, with Rogers and E.H.L. Schwarz* as assistant geologists. From 1896 to 1902 Rogers and Schwarz did extensive field work, either separately or together, mostly during the winter. Their main findings on the structure and stratigraphy of the south-western Cape have stood the test of time and formed the basis for later more detailed work. Rogers was a meticulous observer and, in contrast to Schwarz, cautious in his conclusions. Among others he helped to clarify the structure of the Cape Folded Belt by discovering that the Swartberg is built up mainly of the Table Mountain Sandstone, which has been folded to form a second mountain chain, parallel and similar to the southern Langeberge. In 1899 he began a preliminary investigation of the pre-Cambrian complexes near the Orange River. These proved too difficult to interpret at the time, but during subsequent years he was able to reach more clarity regarding their structure. In 1900 he worked mainly in the mountainous regions of the Clanwilliam and Van Rhynsdorp districts. An important discovery here was a glacial zone in the Table Mountain sandstone, containing finely striated inclusions. His observations were described in two papers published in the Transactions of the South African Philosophical Society in 1902 and 1905. During the Anglo-Boer War (1899-1902) his work was confined to the south coast of the colony and to the Transkei and Pondoland in the east. His large collection of fossils from the Upper Cretaceous deposits at the mouth of the Umzamba River was described by H. Woods* in 1906. After only eight years of field observation Rogers was able to write An introduction to the geology of Cape Colony (1905, 463 pp), a most instructive book based on a wealth of new information that was skillfully synthesized. A second edition, by Rogers and A.L. du Toit*, appeared in 1909. Rogers spent most of the year 1902 on long leave in England. The next year he succeeded Corstorphine as director of the Geological Commission, but continued with survey work. Later that year he temporarily lectured on geology at the South African College, in place of Professor Andrew Young*. During 1904 he discovered that the folded slates and limestones near Vanrhynsdorp, hitherto regarded as of the same age as the Malmesbury Group, was in fact younger, as it overlay conformably the Nieuwerust quartzites. In 1905 he made the important discovery that a stone artefact, later identified as of Mossel Bay type, was associated with the six meter raised beach at Klein Brak. That same year he made a systematic survey of the Cretaceous beds in the vicinity of Uitenhage. The fossil molluscs he collected were described by F.L. Kitchin* in 1908. For the next ten years Rogers worked in the dry northern part of the Cape Colony and gradually elucidated its geological complexities. The University of Cambridge awarded him the degree Doctor of Science (ScD) in 1908. During these years his affiliation was often given as the South African Museum, as he was honorary keeper of its Geological Department from 1902 to 1916. Following the formation of the Union of South Africa in 1910 the Geological Commission was amalgamated with the Geological Survey of the Transvaal to form the Geological Survey of the Union of South Africa. Rogers became its assistant director in 1912, though his headquarters remained in Cape Town. Most of his work up to this time was published in the 16 annual reports of the Geological Commission and in a number of geological maps, but he also contributed papers to the Transactions of the South African Philosophical Society, the Geological Society of South Africa, the Royal Society of South Africa, and other journals. In 1914 he was invited to tour German South West Africa (now Namibia) in the company of the German geographers Professor Fritz Jaeger and Hans von Staff. This visit proved highly instructive for his study of the geology of Namaqualand, as he was able to compare the rocks found north and south of the Orange River. It also enabled him to describe the geology of the large volcanic vent now known as Brukkaros Mountain. Soon afterwards World War I (1914-1918) broke out and the Union of South Africa found itself at war with Germany and its African colonies. In 1916 Rogers succeeded H. Kynaston* as director of the Geological Survey and moved to the Transvaal. There he became mainly concerned, in addition to his administrative duties, with the detailed mapping of the outlying portions of the Witwatersrand Supergroup, and for this purpose made his headquarters first at Johannesburg and then at Heidelberg. He described the goldfields of that district in 1921-1922 and then moved on to the Klerksdorp goldfields. During 1924-1925 he visited England again on leave, during which he presented three lectures on the geology of South Africa at the University of London. Rogers served as president of the Chamber of Mines during 1928-1929. In the latter year he presided over the Fifteenth International Geological Congress, held in Pretoria. That same year he served as joint vice-president of Sections C (Geology) and E (Geography) of the British Association for the Advancement of Science when it held its annual meeting in South Africa. The next year he joined the Vernay-Lang expedition to the Kalahari. His study of its geology formed the subject of two consecutive presidential addresses before the Royal Society of South Africa in 1934 and 1935, dealing respectively with the underlying geology and surface geology of the region. It was his last important field investigation. In addition to his own work, he supervised the publication of many maps and memoirs of great scientific and economic importance compiled by the staff of the Geological Survey. In 1932 Rogers retired from his directorship. Following another visit to England he settled in Mowbray, Cape Town. A major achievement during the next few years was his monograph on The pioneers in South African geology and their work, published as an annexure to Vol. 39 of the Transactions of the Geological Society of South Africa (1937). This masterly account is perhaps his crowning achievement. Much of his time during his retirement was taken up also by laboratory work, particularly a study of diatoms (microscopic unicellular algae with siliceous cell-walls), their present and past distribution in southern Africa and the evidence they might provide for climatic changes during the Tertiary and Quarternary. Despite suffering a severe heart attack in 1938 he was able to complete an account of "The diatom floras", which was published shortly after his death as part of Memoir No. 42 (1947) of the Geological Survey. Rogers's geological work was characterised by an attention to detail and an appreciation of the microstructure of matter, while his writings contain very few theoretical or speculative ideas. In more than 120 publications he dealt with a variety of topics, among them his discovery of glacial beds in the Witwatersrand Supergroup, Numees Formation, Griquatown Group, and Table Mountain Group; his discovery and naming of the Griquatown, Matsap, Waterberg, Koras, Wilgenhoutdrift and Suurberg volcanic groups; the post-Cretaceous climates of South Africa; the origin of the great escarpment; the magmatic copper deposits of Namaqualand; the Blinkklip breccia; the crocidolite deposits of Griqualand West; the prospect of finding oil in the southern Karoo; the first description of local radioactive minerals; the "roaring sands" of Griqualand West; the Tygerberg anticline; the Uitenhage fauna; the pans of the Kalahari; and Verneukpan. In 1925 he wrote "The geological structure of the Union" (34 pp), an explanation to accompany the Geological Survey's first geological map of the Union of South Africa. Rogers was one of the greatest geologists South Africa has seen. The high standard of his work and the high regard in which he was held are shown by the honours conferred upon him by both local and British institutions. He was elected a Fellow of the Geological Society of London in 1906, receiving its Bigsby Medal in 1907 and its Wollaston Medal in 1931; was elected a Fellow of the Royal Society of London in 1918; and in 1935 received an Honorary Fellowship of Christ's College, Cambridge. In South Africa honorary doctorates were conferred upon him by the universities of Cape Town (1923) and the Witwatersrand (1938). He became a member of the South African Philosophical Society in 1896, was elected a foundation Fellow of its successor, the Royal Society of South Africa, in 1908, and served as president of the latter from 1933 to 1935. In 1903 he joined the South African Association for the Advancement of Science, received its South Africa Medal (gold) in 1913, and served as president in 1921/2. As a member of the Geological Society of South Africa from 1903 he served as president in 1915 and received its Draper Memorial Medal in 1936. He joined the South African Biological Society in 1917, receiving its Captain Scott Medal in 1928. In 1917 he also became a foundation member and first president of the South African Geographical Society and addressed its members on "Namaqualand". Many other local and overseas scientific societies had him as either an ordinary or honorary member. Rogers was an examiner in geology for the University of the Cape of Good Hope in 1898 and 1899. He was a lover of books and after his death his personal scientific library was presented to the Royal Society of South Africa. As a keen photographer his albums contained numerous instructive geological and geomorphological illustrations, most developed and printed by himself. He had a happy disposition and was a genial conversationalist. A true researcher, he had no patience with bureaucratic procrastination, political opportunism, or the financial aspects of mining. On 12 April 1902 he married Hester J. van der Riet (sister of Professor B. de StJ. Van der Riet of Stellenbosch), but they had no children.

500 - 1000 €

Amérique du Nord

29
TALCOTT, George / GRAY, Andrew Belcher.

Map of that part of the mineral lands adjacent to Lake Superior, ceded to the United States by the treaty of 1842 with the Chippewas…

geological map
C.B. Graham's Lithy, Washington, D.C, 1845. 910 x 1150 mm.Folded lithographed map, partially colored in pink. Minor foxing, fold marks with tiny splits at intersections. In fine condition.

Mississippi drawn by Joseph Nicolas Nicollet, as well as maps by Douglass Houghton and William Austin Burt. The map was the finest representation of Lake Superior available at the time, with exceptional detail of the Keweenaw Peninsula, Isle Royale, and Talcott Harbor. An illustration in the lower right shows their rustic base, Camp Gray, with log lean-tos, tents, teepees, canoes, drying fish, and a couple of sailboats. Mineral tracts are located and numbered, with leased tracts indicated by hand coloring. The locations of the American Fur Company Posts and Catholic/Methodist Missions are noted. A large inset in the upper right details all of Lake Superior and parts of Lake Michigan. Printed by B. Graham Lithographer, of Washington D.C. The map accompanied a government report issued by the War Department for the 1st Session of the 29th Congress, 1846. The report is entitled "Doc. No. 211: Mineral Lands on Lake Superior" and accompanies this map. Andrew Belcher Gray (July 6, 1820–April 16, 1862) was an American surveyor active in the 20 years prior to the American Civil War. Gray was born in Norfolk, Virginia. He studied surveying under Andrew Talcott and assisted him in 1839 in surveying the Mississippi River Delta. He then joined the Republic of Texas Navy as a midshipman. He was assigned to survey the Texas –U.S. boundary under Memucan Hunt. Later, from 1844 to 1846, he led a team surveying the Keweenaw Peninsula in Michigan in search of mineral resources. Gray returned to Texas to take part in the Mexican-American War and, after the war, was assigned to the U.S.-Mexican Border Commission. After a dispute with his commander, John Bartlett, he was dismissed from the commission only to be replaced by his friend, William Emory. Although Emory's name is on the work, Gray surveyed much of the border from the Rio Grande, over the Black Range, down the Gila River to its junction with the Colorado River, and across the desert of southern California to the Pacific Ocean at San Diego. Having accompanied the border commission as far as San Diego Bay, Gray helped found modern San Diego, California. In 1852, he took work with the Texas Western Railroad and surveyed tracks from San Antonio towards the Colorado River. With the outbreak of the American Civil War, Gray joined the Confederate Army and worked as an engineer fortifying the Mississippi River. He died in 1862 1862 when the boiler of a steamboat he was traveling on exploded. He was survived by a wife and three daughters. George Talcott (December 6, 1786 – April 25, 1862) was an American surveyor and military officer active during the first half of the 19th century. Talcott was born into a Connecticut farming family. He joined the U.S. Army with a rank of Second Lieutenant in 1813. Talcott was transferred to the Ordnance Corps, where he rose rapidly through the ranks. Talcott was an able officer but twice ran afoul of his superiors. The first time occurred when he had a deserter under his command horsewhipped, a punishment Talcott considered a mercy. He was nonetheless brought up on charges of having cruelly abused a prisoner. These charges were dismissed, much to his superior officer's consternation. Despite a narrowly avoided court-martial, Talcott continued to rise through the ranks, becoming, in 1848, Chief of the Ordnance and, shortly thereafter, Brevet Brigadier General. In 1851, Talcott again fell out with his superiors, this time the Secretary of War Charles Magill Conrad (December 24, 1804 – February 11, 1878). With the Civil War brewing and hostilities increasing between the northern and southern states, Conrad took offense at Talcott's awarding a munitions contract to a southern supplier. This second court-martial resulted in Talcott's dismissal from his post and from the Army. Talcott died 10 years later on April 25, 1862. George Talcott should not be confused with Andrew Talcott, an unrelated American military surveyor active during the same period. - Boston Public Library, Leventhal Center, G4112.U6H1 1845

800 - 1500 €

Amérique du Nord

30
STANBURY, Howard.

Stansbury's Expedition / Map of the Great Salt Lake and Adjacent Country in the Territory of Utah . . . (and) Map of a Reconnaissance between Fort Leavenworth on the Missouri River and the Great Salt Lake of Utah made in 1849 and 1850 . . .

geological map
Washington, D.C., 1852. x mm.8vo, publisher’s maroon cloth binding, gilt lettering on front cover, with two folding maps in contemporary hand color. Dimensions of the two maps: 175 × 78 cm and 78 × 114 c. Spine broken, covers detached. The Great Salt Lake map with two long tears along the folds ; the Great Basin map with tears along the folds.

The Earliest Mapping of The Salt Lake City Region, Mormon Settlements and the Overland Route To The Utah Territory Two monumental maps accompanying the report of Howard Stansbury’s explorations in the “Great Basin” and the “Great Salt Lake.” - Map of the Route from Fort Leavenworth to the Great Salt Lake - The first map shows the route from Fort Leavenworth, Kansas Territory, on the Missouri River, to Pilot Peak, immediately west of the Great Salt Lake. The map follows the Platte River through the Plains of Kansas and Eastern Colorado (not yet a territory), passing through the lands of the Pawnee Nation and the Sioux Nation to Fort Laramie and Fort Bridger, before crossing the Wasatch Mountains into the Great Basin. Great Salt Lake City is shown at the south end of the lake, with significant topographical detail given in the area of Salt Lake and Utah Lake, along with observations on the lands along the way regarding water and prospects for farming and pasture lands. The region traversed is still Indian Territory and Utah Territory, with a large section of Oregon Territory (now Idaho) shown. - Map of the Great Salt Lake and Adjacent Territory - The earliest obtainable map of the Salt Lake region, published as part of Stansbury's Report on the region. The map extends a bit west of the Lake to the Uinta's and South to Lake Utah, Mt. Nebo and the "Youab Valley," as well as considerably east of the lake and the Wasatch, including a town plan for Salt Lake and Ogden City, along with roads, other towns, rivers, etc. The Emigrant Road to California is noted along the top. Carl Wheat, in his foundational book on the mapping of the Transmississippi West, described Stansbury's map as: "a major production...for the Great Salt Lake itself the map was definitive...Scientific cartography for the Territory of Utah may be said to date from the appearance of this map." Davide Rumsey notes that Stansbury's map "is a stunning map, large in scope, and clearly shows the genius of Charles Preuss as a cartographer." Stansbury Expedition : The maps accompanied Howard Stansbury's Report, Exploration and Survey of the Valley of the Great Salt Lake of Utah, including a Reconnaissance of a new Route through the Rocky Mountains. The Stansbury expedition was one of the most important early expeditions to the West. In 1849, Stansbury was ordered to travel from Fort Leavenworth, Kansas to survey the Great Salt Lake in Utah, to evaluate emigration trails along the way (especially the Oregon and Mormon trails), and to scout for possible locations for a transcontinental railroad. The expedition consisted of 18 men including second-in-command Lieutenant John Williams Gunnison. During the next two years, the expedition explored the Great Salt Lake, Utah Lake and the Cache Valley of northern Utah all the way to Fort Hall in southern Idaho. When Stansbury arrived in the Utah Territory, the Mormon leaders were worried that the expedition was part of an effort by the U.S Government to oust the settlers. Stansbury held a meeting with Brigham Young to assure him that the expedition was purely scientific. Young responded by assigning his personal secretary, Albert Carrington, to assist the expedition. In his report, Stansbury wrote: "This pledge thus heartily given was as faithfully redeemed and it gives me pleasure here to acknowledge the warm interest manifested and efficient aid rendered as well by the president as by all the leading men of the community both in our welfare and in the successful prosecution of the work". In 1850, he advised Brigham Young on the extermination of the Timpanogos, which he said "could not but meet my entire approval" and gave supplies for the Battle at Fort Utah. Upon completing the mission in Utah, the expedition started back east to Leavenworth. Rather than follow the standard Oregon Trail route from Fort Bridger over South Pass through the Sweetwater River Valley, Stansbury wanted to scout a more direct route east. Following the advice of Jim Bridger and local trappers and traders, the expedition followed the Blacks Fork River eastward, crossed the Green River near the present town of Green River, Wyoming, and proceeded east along the Bitter Creek Valley, crossing the Red Desert, and skirting the northern side of Elk Mountain across the Laramie Plains. They passed over the Laramie Mountains and made their way to Fort Laramie where they struck the Oregon Trail heading east. Stansbury noted of the journey: "Having now brought our reconnoissance [sic] for a new route from the waters of the Pacific to a point where its results can be at least approximately ascertained it is very gratifying to be able to state that these results are in a high degree satisfactory more so indeed than I had anticipated. It has been ascertained that a practicable route exists through the chain of the Rocky Mountains at a point sixty miles south of that now generally pursued and in a course as much more direct as the chord of an arc is than the arc itself".

300 - 400 €

Amérique du Nord

31
EMORY, H. and HERBST, F.

Boundary between the United States & Mexico : shewing the initial point. Under the Treaty of December 30th 1853…

geological map
[Washington D.C. ], 1855. 620 x 950 mm.Two-sheet map, joined and linen-backed. A good condition, despite a brown stain in the middle of the right part, with some offsetting onto the left half.

Boundary between the United States & Mexico : shewing the initial point. under the Treaty of December 30th 1853 / astronomically determined and surveyed in 1855. under the direction of William H. Emory, U.S. Commissioner ; projected & drawn by F. Herbst. Printed to accompany the report of the commission.; Map titles in English and Spanish.; Published also as Senate document 247 (v. 25) 55th Congress, 2nd session. Map only, without the Survey Report. "The United States and Mexican Boundary Survey was a land survey that took place from 1848 to 1855 to determine the Mexico–United States border as defined in the Treaty of Guadalupe Hidalgo, the treaty that ended the Mexican–American War. In 1850, the U.S. government commissioned John Russel Bartlett to lead the survey. The results of the survey were published in the three volumes entitled Report on the United States and Mexican boundary survey, made under the direction of the Secretary of the Interior by William H. Emory (1857–1859). In addition to documenting the new boundary, the survey report was notable for its natural history content, including paleontology, botany, ichthyology, herpetology, ornithology, and mammalogy. The survey was also provided to the War Department, now known as the United States Department of War, to support the construction of a railroad line. In the report's section titled "Personal Accounts", a brief description of Panama is also included, along with the experiences he and his men had while conducting the survey, including the experiences of having insufficient funding, which was essentially starving out the men as prices around them rose, trying to exploit their presence. Further funds were eventually sent, but only after a period of disarray over changes in the project's management. Even when the funds were sent, they were embezzled by one of the new commissioners, prompting Emory to go to Washington himself to secure additional funds. Even after this, the funds still took time to reach the workers, who, after Emory's return, had begun mutinying and rioting, causing a complete halt in production. Emory, to resolve the situation, was given authority by the Department of the Interior to requisition funds, which he used to pay a portion of the workers. Instances of attacks from Native Americans on survey groups are also noted in the accounts, with a request to the War Department for military escorts. Twenty-five hand-colored lithographic plates of birds were included in the volume Zoology of the Boundary, edited by Spencer Fullerton Baird. These illustrations were prepared by J.T. Bowen and Company of Philadelphia, the same firm that had produced the octavo edition of Audubon's Birds of America. Numerous illustrations of plants, reptiles, and amphibians were included, and some editions were colored. The hand-colored lithographs of scenery and ethnography are important historical records. As a result of the boundary survey and subsequent treaties, the U.S. and Mexico established the International Boundary and Water Commission (IBWC) in 1889 to maintain the border, allocate river waters between the two nations, and provide for flood control and water sanitation. Once viewed as a model of international cooperation, in recent decades the IBWC has been heavily criticized as an institutional anachronism". TREATY OF GUADALUPE HIDALGO : The Treaty of Guadalupe Hidalgo officially ended the Mexican–American War (1846–1848). It was signed on 2 February 1848 in the town of Guadalupe Hidalgo. After the defeat of its army and the fall of the capital in September 1847, Mexico entered into peace negotiations with the U.S. envoy, Nicholas Trist. The resulting treaty required Mexico to cede 55 percent of its territory, including the present-day states of California, Nevada, Utah, most of Colorado, New Mexico and Arizona, and a small portion of Wyoming. Mexico also relinquished all claims to Texas and recognized the Rio Grande as Texas's southern boundary. In turn, the U.S. government paid Mexico $15 million "in consideration of the extension acquired by the boundaries of the United States" and agreed to pay debts owed to American citizens by the Mexican government. Mexicans in areas annexed by the U.S. could relocate within Mexico's new boundaries or receive American citizenship and full civil rights. The United States ratified the treaty on 10 March and Mexico o9 May. The ratifications were exchanged on 30 May, and the treaty was proclaimed on 4 July 1848.

4000 - 6000 €

Amérique du Nord

32
IVES, Joseph C.

Military Map of the Peninsula of Florida South of Tampa Bay Compiled From The Latest and Most Reliable Authorities . . . April 1856.

geological map
New York, 1856. 1060 x 830 mm.Large pocket folding map into original gilt-lettered cloth covers. The map is bound with: Memoir to accompany a Military Map of The Peninsula Of Florida. 42 pages. New York, 1856.

Very rare first edition of this large cornerstone map of Florida, produced during the Third Seminole War. The map was issued to illustrate "Memoir to accompany a Military Map of The Peninsula Of Florida", published in 1856. The main areas of activity during the Third Seminole War, the territory just west of Lake Okeechobee, and the northern end of Big Cypress Swamp, are shown in incomparable detail. Ives shows all local Indian settlements, along with the locations and dates of relevant skirmishes and battles up to April 1856. Third Seminole War. The third and final Seminole War started when a surveying expedition under the command of Lieutenant Hartsuff, stumbled upon a garden owned by Billy Bowlegs, an important local Seminole chief. Hartsuff's party began destroying the garden, and Bowlegs discovered them doing so. He objected to the destruction of his crops and was brutalized by the soldiers. While Hartsuff's team was preparing to leave for Fort Myers the next morning, they were attacked by Bowlegs and a group of Seminole warriors. Four of the eleven members of the party were killed and scalped, while the rest were able to make it back to Fort Myers. Hartsuff's route and the location of the skirmish are both noted on this map.The war continued for three years. Bowlegs was eventually convinced to accept a cash payment from the United States government, and he moved his people west to the Indian Territory in what is now Oklahoma. It is said that when they went through New Orleans on their way to the Indian Territory, Bowlegs had two wives, several children, $100,000 in cash, and many slaves with him. When Bowlegs established himself in the Indian Territory, he was said to have been one of the bigger slaveholders in the region. The small territory that was still occupied by the Seminole Indians at the outset of the third war, is described on this map in great detail. The map shows the extent to which the Indians had been pushed deep into Big Cypress Swamp and up to the northern edge of the Everglades by the previous wars and the policies of Andrew Jackson. Ives gives a good sense of the distribution of the Seminoles who had remained in Florida to the mid-1850s with the depiction of the villages in Big Cypress Swamp: Billy's Town, Billy Bowlegs Old Town, Sam Jones Town, Bowlegs Town, Stuttering Bill's, etc. At least seven battlegrounds from the Second and Third Seminole Wars are shown on the map. They date up to 1856 and include the following: Battle of Okeechobee December 25, 1837 Jesup's Battle January 24, 1838 Battle of December 20, 1841 Lieut. Hartsuff's Skirmish of December 1855 (marking the beginning of the third war) Battle of January 1856 Battle of April 7, 1856 Battle of March 29, 1856 (the map was published the following month) The map illustrates over 45 forts or military depots. Interestingly the vast majority of these are unoccupied; of the forts shown, only nine are labeled occupied on the map. The map illustrates the following occupied forts: Fort Deynaud Fort Capron Fort Green Fort Hartsuff Fort Dulaney Fort Simon Drum Fort Dallas Fort Frazer Fort Meade And these unoccupied forts: Fort Lauderdale Old Fort Lauderdale Fort Jupiter Old Fort Jupiter Fort T. B. Adams Fort Thompson Fort Pierce Fort Loyd Fort Van Swearingen Fort Drum Fort Vinton Fort Kissimmee Fort Chokkonikla Fort Myakka Fort Arbuckle Fort Clinch Fort Keais Fort Doane Fort Shackelford Fort Myers Fort Hamer Fort Crawford Fort Brooke Fort Carroll Fort Chokkonikla Fort Harrell Fort McRae Fort Westcott Fort Simmons Fort Center Fort Henry Old Depot No. 2 Temporary Depot No. 1 Temporary Depot No. 2 / Old Fort Foster Fort Basinger Fort Gardner In addition to the battles and forts described on the map, its other major contribution to our understanding of the military history of South Florida is its inclusion of the routes of 25 military surveys and expeditions spread between the Second and Third Seminole Wars. The routes are as follows: Screven's route Major Lauderdale's route Colonel Harney's route Colonel Taylor's route General Twigg's route Colonel P. Smith's route Captain Waites's route Captain Wright's route General Eustis's route Captain Pratt's route Colonel Taylor's route Lieutenant Hartstuff's route of 1835 Captain Allen's route of 1838 Colonel Davenport's route of 1839 Major Graham's route of January 1842 Captain Wade's route of 1842 Captain Wade's return route Captain Ker's route of 1842 Lieutenant Benson's route of 1854 Captain Dawson's route of 1855 Lieutenant Haines's route 1855 Major Hays's route 1855 Lieutenant A.P. Hill's route of 1855 Lieutenant Platt's route of 1855 Major Hayes's route of 1855 The map features a stunning level of ecological detail; six categories of land are differentiated: sawgrass, swamp, marsh, scrub, wet prairie, dry prairie, wet hammock, and dry hammock. The map also specifies the following forest types: pine, palmetto, oak, cypress, and "koontee" (also called "koonti", and now referred to as Florida arrowroot or wild sago). The map's coverage of the entirety of the Everglades and surrounding areas, as well as the present-day metropolitan areas of Miami, Palm Beach, Tampa Bay, and Fort Myers, offers a peerless opportunity to contrast south Florida's pre-development landscape with how it looks today. The map shows very few American towns. Tampa is shown as a village and there are single dwellings scattered around the bay but other than that there is very little development. There are collections of houses near Indian River and in the Florida Heartland. In fact, there were few enough houses that Ives could name the individual owners of many of them. Two lighthouses are shown, namely those on Key West and at Cape Florida on Key Biscayne. Particular care was taken to describe various transportation routes: wagon roads, blazed routes, and trails are shown separately. Indian boundaries are shown. There are proposed canal routes as well. Joseph Christmas Ives The map was compiled by Joseph Christmas Ives (1829-1868), under the orders of then-Secretary of War of the United States, Jefferson Davis. Ives was an important figure in the mapping of the American frontier. He graduated from the United States Military Academy in 1852, and from 1853 to '54 he served as a Second Lieutenant with the Topographical Engineers on Whipple's Pacific Railroad survey of the 35th parallel. After the completion of his map of Florida in April 1856, Ives led an expedition over two years, to explore the upper Colorado River. As a result of this expedition he was responsible for the earliest scientific mapping of the Grand Canyon and its environs. From 1859 to 1860, after his expedition out west, Ives worked as an engineer and architect on the Washington Monument. At the beginning of the Civil War he declined a promotion in the U.S. Army. And in spite of having been born in New York City, Ives took a commission with the Confederates. He filled several engineering roles until he became aide-de-camp, with the rank of colonel, to President Jefferson Davis. He served in this capacity from 1863 to 1865. It is noteworthy that he also served under Jefferson Davis when Davis was Secretary of War during the 1850s. It has been suggested that this relationship is what led Ives to fight for the Confederacy.

4000 - 6000 €

Amérique du Nord

33
SAFFORD, James, M.

A Geological Reconnaissance of the State of Tennessee; Being the Author's First Biennial Report . . .

geological map
Nashville Tenn., G. C. Torbett & Co., 1856. x mm.8vo, publisher’s cloth binding, gilt title on front cover. Binding slightly rubbed, with some foxing affecting the text and the map, and minor splits along the folds. Color lithographed lithographed map on thin paper, with some contemporary hand color, folded into its accompanying booklet by J. Safford.

The First Comprehensive Geological Study of Tennessee Rare Nashville printing of James M. Safford's Geological Map of Tennessee, lithographed by J. Wagner, complete with James Safford's extremely rare work on the Geology of Tennessee, entitled A Geological Reconnaissance of the State of Tennessee; Being the Author's First Biennial Report . . . (Nashville: G. C. Torbett & Co., 1856). Safford's work provided the first in-depth analysis of the state’s geological features and natural resources. In the book, Safford described the stratigraphy, mineral deposits, and overall geological composition of Tennessee, offering insights that would later inform his more detailed work in Geology of Tennessee (1869). The present 1856 publication was critical in bringing attention to Tennessee’s geological wealth, particularly its rich deposits of phosphate and iron ore, which would play significant roles in the state’s economic development. The section on iron includes a table of the iron ore furnaces operating in Tennessee, listing the firm names and owners. There are also chapters on copper and lead & zinc. The lithographer, James E. Wagner, was an artist who worked in Nashville from 1840 to 1860, and exhibited his work at the Capitol in 1858 with what the Tennessee Historical Society called "some of our very best artists." Wagner also produced lithographs of Nashville in the years leading up to the Civil War, including an 1858 view of Nashville's Zollicoffer Bridge and levee on the Cumberland River. The woodcut geological diagrams that illustrate the text were made by a local Nashville artist, H. Bosse. James Merrill Safford (1822–1907) was an influential American geologist, chemist, and professor whose contributions to the geological study of Tennessee remain critical to the state’s scientific heritage. Born on August 13, 1822, in Putnam, Ohio, Safford pursued advanced education in chemistry at Yale University. His academic career began in 1848 when he was appointed as a professor of Chemistry and Geology at Cumberland University in Lebanon, Tennessee, where he taught for more than two decades. In 1875, he joined Vanderbilt University, where he served as a professor of mineralogy, botany, and geology until his retirement in 1900. In 1854, Safford was appointed as Tennessee’s State Geologist, directing the Second Geological Survey of the state. However, his earliest contributions to geology began shortly after his appointment at Cumberland University in 1848. By the early 1850s, Safford had already established himself as a promising geologist through his investigations of the Middle Tennessee region, specifically focusing on its Silurian formations. His early work in Middle Tennessee, now referred to as the Nashville Dome, culminated in two critical publications that set the foundation for his later achievements in the field. Safford’s reputation as a geologist grew with the publication of his 1856 book A Geological Reconnaissance of the State of Tennessee. This work was the first comprehensive geological study of Tennessee, providing an in-depth analysis of the state’s geological features and natural resources. In the book, Safford described the stratigraphy, mineral deposits, and overall geological composition of Tennessee, offering insights that would later inform his more detailed work in Geology of Tennessee (1869). His 1856 publication was critical in bringing attention to Tennessee’s geological wealth, particularly its rich deposits of phosphate and iron ore, which would play significant roles in the state’s economic development. His most significant achievement in this role was the publication of Geology of Tennessee in 1869, a seminal work that included the first colored geologic map of the state. This publication cemented Safford’s reputation as a pioneer in geological mapping in the United States. His map provided critical insights into the topography, mineral resources, and geological formations of Tennessee, becoming a reference point for scientists and industrialists alike. The work remained foundational for decades and continues to be cited in geological research today. Throughout his career, Safford was deeply involved in efforts to apply geological science to practical and economic concerns. His collaboration with Tennessee’s Commissioner of Agriculture, leading to the 1874 publication of Introduction to the Resources of Tennessee, was a landmark in promoting the state’s mineral and agricultural resources. This work was an important step in integrating scientific knowledge with the economic development of Tennessee, and Safford's geological contributions were highlighted at the 1876 Philadelphia Exposition, where he oversaw displays on Tennessee’s mineral wealth. Beyond his geological work, Safford was a prolific academic, publishing fifty-four books, reports, and maps. His teaching career spanned over fifty years, during which he held professorships at Cumberland University and Vanderbilt University. At Vanderbilt, he was known for his dual roles in the Academic and Medical Departments, where he taught natural sciences and served as Dean of the Pharmaceutical Department from 1886 until his retirement in 1900. He also acted as Secretary to the Faculty and had a significant role in shaping the university’s curriculum in natural history and geological studies. Safford’s contributions extended beyond geology and education. He was appointed to Tennessee’s Board of Health, where he served for thirty years. His expertise in chemistry and geology informed his work as a chemist for the Tennessee Bureau of Agriculture during the 1870s and 1880s. His research often intersected with public health concerns, including the study of water supply, soils, and the geological aspects of disease prevention. In recognition of his contributions to geology and academia, Yale University awarded Safford an honorary Ph.D. in 1866, one of the earliest honorary doctorates in the field of geology. His career was marked by a balance of teaching, public service, and scientific inquiry, with his work continuing to influence geological research and education in Tennessee and beyond.

800 - 1000 €

Amérique du Nord

34
BROADHEAD, G. C.

Atlas Accompanying Reports of Missouri Geological Survey.

geological map
Jefferson City, MO, 1874. 370 x 330 mm.Paperback atlas, dirty paper cover. 14 plates of color geological maps and graphs. Slight yellowing, some foxing.

Illustrated with 11 maps (1 folding, 10 colored) and 4 plates (1 folding). The maps drawn by T. J. Caldwell depict the following counties, keyed by geological composition: Cedar, Barton, Vernon, Bates, Howard, Madison, Jasper, and Newton, with other maps of multi-county areas. - LeGear : L2056

200 - 300 €

Amérique du Nord

35
WALKER, Francis A.

Statistical atlas of the United States based on the results of the ninth census 1870 with contributions from many eminent men of science and several departments of the government.

geological map
J. Bien, lith, [New York], 1874. x mm.Large folio. Half brown-violet leather with corners, gilt edges. Title, index, and plates numbered I–LIV. Spine and corners rubbed; lower corner of the front marbled endpaper cut ; small tear at foot of title-page. Dedication by Blake: “Presented to the Geographical Society of France, Nov. 10th, 1878.”

A monumental visual and statistical record of the United States at the close of the Reconstruction era, the first national statistical atlas ever produced by the U.S. government. Compiled under the direction of Francis Amasa Walker, Superintendent of the Ninth Census, and published by the Department of the Interior’s Census Office in 1874, this impressive work synthesizes an extraordinary range of data on the nation’s geography, economy, demography, and resources. The Statistical Atlas stands as a milestone in American cartographic and statistical history, representing one of the first comprehensive attempts to visualize demographic and economic data through maps and graphics. It influenced subsequent U.S. census atlases and set the standard for data visualization in the late 19th century. Published by Department of the Interior - Census Office; Jules Bien, Lith, 1874 Preface and introduction, by the compiler.--Index to maps and charts.--The physical features of the United States, by Prof. J.D. Whitney.--The woodlands and forest systems of the United States, by Prof. William H. Brewer.--Geological map of the United States and territories, by Chas. H. Hitchcock and Wm. P. Blake.--The gold and silver mines of the West, by Prof. Rossiter W. Raymond, U.S. Commissioner of Mining Statistics.-- The coal measures of the United States, by Prof. C.H. Hitchcock.--Areas and political divisions of the United States, 1776-1874, by S.W. Stocking, United States Patent Office.--The minor political divisions of the United States, by S.A. Galpin.--The progress of the nation--1790-1870, by the compiler of the atlas.--An approximate life-table for the United States on thebasis of the ninth census, 1870, by E.B. Elliott, U.S. Bureau of Statistics.--The relations of race and nationality to mortality in the United States, by the compiler of the atlas - Phillips, Atlases, 1335. – Guthor- n, U.S. National Atlases, p. 24. – Ristow, American Maps and Mapmakers, pp. 453–456. – Rumsey 4003

200 - 300 €

Amérique du Nord

36
United States Geological Survey / VANDEVEER HAYDEN, Ferdinand.

Preliminary Map of Central Colorado Showing the Region Surveyed in 1873 and 1874.

geological map
Washington, D.C., 1875. 580 x 635 mm.Map on thin paper folded in the middle. Crease marks, small tears in the margins, slightly creased paper, very slight foxing.

Detailed map of the western half of Colorado, published by the United States Geological Survey. In the west, the map extends to the Grand Junction area and south to Silverton and the San Miguel and Mount Wilson areas. The Hayden Survey of Colorado The late 1860s and early 1870s saw four great surveys of the American West: the King Survey, which mapped the region around the 40th parallel; the Wheeler Survey, which attempted (unsuccessfully) to map the whole of the territories and western states at a moderate scale; the Powell Survey, which focused on the southwest and the Grand Canyon region; and finally the Hayden survey, which surveyed the territory of Colorado as well as the last great unmapped region of the Lower Forty-Eight: the Yellowstone Basin. The Colorado survey was sandwiched between Yellowstone surveys and conducted in the years 1873-75. Hayden expected Colorado to soon become an important region because of the arrival of the railroads, and thus decided to expend enormous resources in order to create what would be one of the most extensive regional surveys anywhere in the world. Each year, Hayden would subdivide his team into four groups, each consisting of a number of geologists, cartographic experts, and scientists, with each group assigned to a specific area. Ferdinand Vandeveer Hayden, known to the Sioux as "man-who-picks-up-stones-running," stands among the pantheon of eminent geologists of the 19th century. Hayden's academic career commenced at Oberlin College, and he furthered his education at Albany Medical College, where he received his M.D. in 1853. Despite his medical training, Hayden was primarily engaged in geology, a field to which he would dedicate his life's work. Hayden commenced his geological career with a survey in the Nebraska Territory in 1856. In 1859 and 1860, he conducted further exploratory work in the Rocky Mountains, particularly in Colorado, which was then part of the Nebraska and Kansas territories. His early work in the field earned him the respect of Native American tribes, with the Sioux reportedly dubbing him "man-who-picks-up-stones-running" due to his avid and energetic collection of geological samples during his expeditions. By the 1860s, Hayden had risen to prominence as a geologist and was appointed the United States Geologist for the Geological Survey of the Territories. This role would define his career, leading numerous surveys in the Western United States. Notably, from 1871 to 1872, Hayden led a survey into the region that would become Yellowstone National Park, and his reports significantly contributed to the establishment of Yellowstone as the first National Park in 1872. Hayden's most significant contribution to geological literature was the Geological Atlas of Colorado, published in 1877. This work was the result of comprehensive surveys conducted across Colorado, meticulously documenting the state's geography and geology. The atlas offered detailed maps on a scale previously unseen, encompassing not only Colorado but adjacent areas, including parts of Utah, Arizona, and New Mexico. Hayden's influence extended to academia, as he was affiliated with the University of Pennsylvania for a period, where he held the position of professor of geology. His academic and field work combined to form a substantial body of knowledge that would be used by future scholars and explorers. Ferdinand V. Hayden passed away on December 22, 1887, in Philadelphia, Pennsylvania. His enduring legacy is reflected in the numerous natural features named after him, including Hayden Valley in Yellowstone and Mount Hayden in Colorado. His contributions to geology during the 19th century remain a cornerstone of American geological and geographical sciences.

300 - 500 €

Amérique du Nord

37
WHEELER, G.

Geographical Explorations and Surveys West of the 100th Meridian/ Topographical Atlas (crayon).

geological map
Washington D. C., 1875. x mm.Folio atlas with 9 loose colored printed maps, front paper cover only, with on the verso a printed label: “With the compliments of Geo. M. Wheeler, Captain of Engineers, U.S. Army.” Maps with some scattered foxing and marginal tears.

Atlas illustrated with 9 maps depicting the American West in 1875, based on the topographical and geological surveys of G. Wheeler. Atlas documenting the progress of the Wheeler Survey (U.S. Geographical Surveys West of the 100th Meridian) from 1875 to 1880. Only containing the 9 folding maps from the year 1875. One of the four great surveys of the American West (in addition to the King, Hayden, and Powell Surveys), the Wheeler Survey ran from 1869-1879 with primary goals that included: creating a better geographical map of the west; determining the geological, botanical, and zoological points of interest in the west; and mapping possible routes for roads and railroads. These reports were published as appendices to the Annual Report to the Army Chief of Engineers. George Wheeler and The Geographical Surveys West of the 100th Meridian George Montague Wheeler was placed in charge of mapping the western United States for the US Army Corps of Engineers at the age of 26. With a team comprising several dozen army officers and civilian scientists, he would embark on his first early expeditions in 1869 and 1871. Public support for the surveys would blossom following the publication of William Bell and Timothy O'Sullivan's photographs of the west, and Congress would formally appropriate funds for mapping the territories west of the 100th meridian in 1872. The US Army Chief of Engineers, Andrew Humphreys, had initially conceived of a survey that not only focused on geographical mapping but also understanding the economic resources and scientific interest of the western American possessions. He described the purpose of the surveys as: [to] obtain correct topographical knowledge of . . . Everything relating to the physical features of the country, the numbers, habits, and dispositions of the Indians who may live in this section, the selection of such sites as may be used for future military operation or occupation, and the facilities offered for making rail or common roads . . . The mineral resources that may be discovered . . . The influence of climate, the geological formations, character and kinds of vegetation, its probable value for agricultural and grazing purposes, relative proportions of woodland, water, and other qualities which affect its value. . . Such an extensive survey of such an expansive area would take a long time to complete, but Wheeler progressed quickly. By 1879, large portions of Utah, Colorado, Nevada, Arizona, and New Mexico, along with parts of California, would be mapped. In that year, however, Congress would decide that having four overlapping surveys of the west, both military and civilian, was inefficient. The surveys would then be agglomerated into the newly formed USGS, although Wheeler would publish several later reports based on previously collected data.

1000 - 1500 €

Amérique du Nord

38
WHEELER, G.

U. S. Geographical surveys west of the one-hundredth meridian. Topographical atlas.

geological map
Washington, 1878. x mm.Paper cover serving as title page (cut out) and 11 large folio maps, including one large folding map, "Topographical Map of Lake Tahoe…" (104 × 870 cm), with a 10 cm tear along the center, a small hole at the fold intersection, and a marginal tear at the lower edge; minor foxing.

Atlas comprising 11 large maps, including the rare topographical map extending from Lake Tahoe to Mud Flat, Horse Lake and the area above Pyramid Lake. Shows towns, roads, mountains, rivers, lakes, hydrographical details, etc. Tmap was prepared during the Wheeler Survey. The Wheeler Survey was a survey of a portion of the United States lying west of the 100th meridian. It comprised multiple expeditions and was supervised by First Lieutenant (later Captain) George Montague Wheeler. The survey team included Lieutenant (later Brigadier General) Montgomery M. Macomb. Wheeler led early expeditions from 1869 to 1871 in the west, and in 1872, the US Congress authorized an ambitious plan to map the portion of the United States west of the 100th meridian at a scale of 8 miles to the inch. This plan necessitated the Wheeler Survey. The survey's main goal was to make topographic maps of the southwestern United States. In addition, Wheeler's survey was undertaken to ascertain everything related to the physical features of the region; discover the numbers, habits, and disposition of Indians in the section; select sites for future military installations; determine facilities available for making rail or common roads; and note mineral resources, climate, geology, vegetation, water sources, and agricultural potential. The Wheeler Survey lasted until 1879, when the survey, along with the King and Powell Surveys, were terminated and their work was reorganized as the United States Geological Survey.

800 - 1200 €

Amérique du Nord

39
JENNEY, Walter P. / NEWTON, Henry.

Topographical and geological atlas of the Black Hills of Dakota.

geological map
Julius Bien, Lith. New York, 1879. 820 x 570 mm.Large folio atlas. Lithographic title, bird’s-eye view and 2 folding color lithographed maps. Large tear (15 cm) into the view.

Imposing and very rare atlas of the first detailed surveys of the Black Hills. Without the accompanying report. The atlas is illustrated with a title page, a bird’s-eye view, and two lithographed maps of the Black Hills. The Map of the Black Hills of Dakota shows relief both by hachuring and by contour lines (though the interval is not specified) and pays close attention to the complex network of rivers and streams forming the Cheyenne watershed. A striking number of towns, settlements, and mining camps appear, having sprung up in only a few years, while the western boundary of the Sioux Reservation is marked at 103° west longitude. The Geological Map of the Black Hills of Dakota covers the same area, without hachuring, but distinguishes eleven different geological formations indicated by printed colors. After the discovery of gold in the Black Hills by miners accompanying Custer’s 1874 expedition, the federal government expropriated the Sioux Lakota from the region, in violation of the Treaty of Fort Laramie. As settlers and prospectors streamed in, in May 1875 the Department of the Interior sent a large scientific expedition led by Walter P. Jenney, assisted by Henry Newton. Their Report on the Geology and Resources of the Black Hills of Dakota finally appeared in 1880, after long delays, preceded in 1879 by the Atlas offered here (both Jenney and Newton were already dead by that time, though Newton lived long enough to be listed as first author). The historian Wheat attributes this delay in publication to infighting within the scientific community: “When presented to Congress its publication would have been immediately authorized except for a selfish and heartless opposition it encountered, born of the fear that it would betray the inaccuracy of previously published descriptions of the geology of the region [a scarcely veiled allusion to F. V. Hayden]. This opposition cost Mr. Newton his life: when Congress deferred action on this report until another session, he determined to employ part of the interval in revisiting the Black Hills, repeating some of his observations and recording the results of the rapidly developing mining industry. While engaged in this work, he contracted typhoid fever and died at Deadwood, August 5, 1877.” (Wheat, V:2, pp. 329-30, quoting Newton J.S. Newberry in the Preface to the Report). - Phillips, List of Geographical Atlases in the Library of Congress, vol. I #25 Rumsey #2083. Wheat, Transmississippi West, vol. V:2, pp. 318-319, 329-331

1500 - 2000 €

Amérique du Nord

40
U.S. Coast and Geodetic Survey / COOK, George H. and SMOCK, John C.

A topographical map of a part of Northern New Jersey.

geological map
[Trenton], Geological Survey of New Jersey, 1882. 890 x 910 mm.Colour lithographed folding map sectioned and mounted on cloth.

Map showing northern New Jersey lithographed by Julius Bien. Based on a projection by the U.S. Coast and Geodetic Survey. The southern part is missing. Covers the Newark area and the adjacent part of New York. Details include topography, street and road networks, rail lines, cities, and many other elements that attest to the precision and care taken in its production. - Library of Congress : G3814.N5A1 1882 .N4

300 - 500 €

Amérique du Nord

41
United States Geological Survey / DUTTON, Clarence Edward.

Atlas to Accompany the Monograph on the Tertiary History of the Grand Canon District + Monographs of the United States Geological Survey, vol. II.

geological map
Washington, Julius Bien & Co. Lith. New York, 1882. x mm.Folio, original gilt cloth, 22 double-page plates, 10 tinted and chromolithographic views, 12 chromolithographic maps. With one accompanying quarto text volume (vol. II). Spine reinforced with black cloth.

Dutton's spectacular atlas of the Grand Canyon, published in connection with the Powell Geological Survey, with a fine series of chromolithographic maps and views after artists Thomas Moran and William Henry Holmes. The first publication of the United States Geological Survey, this atlas stands as one of the most remarkable products of any western survey. Arising from Dutton's time on John Powell's survey of the Grand Canyon in 1879- 81, the atlas and accompanying monograph were projects Dutton had inherited from Powell, who had intended to write it years before. Proposed as part of a series to include works by Powell and Grove K. Gilbert, the greatest American geologist of the nineteenth century, Dutton's were the only publications to come to fruition. While Dutton's text elegantly described the geological history of the Canyon region, paying minute attention to the volcanic activity in which he specialized, the atlas, containing lithographic and wood-engraved views after the drawings of William H. Holmes and Thomas Moran, marked a clear break from European-style depictions of the Canyon. Where previous illustrations of the Canyon had favored green tones and gray hues, "Holmes's sketches and panoramas, on the other hand, are all but photographic in their depiction of reality…The flavor of the country is squeezed out, and the image of the Colorado Plateau and its marvelous chasm are corrected forever in science and literature…Holmes had seen the country with the eyes of an artist and a scientist" (Anderson). The plates after Holmes include a "View of the Temples and Towers of the Virgen," a "view looking eastward from Vulcan s Throne disclosing the Inner Gorge of the Grand Cañon, the great esplanade, and the upper or outer walls on either hand," "the Panorama from Point Sublime in the Kaibab," among others, while the lithograph after Thomas Moran depicts "the Transept…lateral gorge opening into one of the branches of the Bright Angel Amphitheatre in the Kaibab." Editor and compiler of the atlas Clarence Edward Dutton (1841 1912), the son of a Connecticut-based boot salesman, was a Yale University graduate and Civil War Captain. After the war, in the 1870s, Dutton became friends with Grand Canyon explorer John Wessley Powell, the two bonding over their shared interests in artillery and geology. In 1875, the War Department attached Captain Dutton to Powell's survey, during which he would explore and map the volcanic activity in the Kaibab and North Rim regions of the Canyon from 1879 1881. Opting for descriptive illustrations instead of purely artistic renditions, Dutton's decision to enlist Thomas Moran and William Henry Holmes as the Canyon's artists resulted in the most accurate depictions of the region up to that time. Artist William Henry Holmes (1846 1933) was, among other things, an anthropologist, archaeologist, draftsman, and museum director, who began his illustration practice by depicting the fossils and specimens for Fielding B. Meek s paleontological reports from 1871. From 1872 1879, while serving on the Hayden expedition, he helped to illustrate views of Yellowstone, the Mount of the Holy Cross in Colorado, and other Western sites. After providing highly detailed drawings and watercolors of the Grand Canyon region for Dutton in 1882, Holmes taught anthropology at the University of Chicago and directed the Bureau of American Ethnography and National Gallery of Art in Washington D.C. Julius Bien (1826 1909) is best known for his elephant chromolithographic folio edition of Audubon s Birds of America, printed between 1858 and 1862 John Wesley Powell (March 24, 1834 – September 23, 1902)[1] was an American geologist, U.S. Army soldier, explorer of the American West, professor at Illinois Wesleyan University, and director of major scientific and cultural institutions. He is famous for his 1869 geographic expedition, a three-month river trip down the Green and Colorado rivers, including the first official U.S. government-sponsored passage through the Grand Canyon.

1500 - 2000 €

Amérique du Nord

42
COOK, George Hammel / GEOLOGICAL SURVEY OF NEW JERSEY.

Atlas of New Jersey.

geological map
Julius Bien and C°, New York, 1888. 615 x 445 mm.Large folio atlas in double sheets comprising 17 regional maps, 1 map of the state of New Jersey, and 1 relief map, all lithographed in color except for the map of New Jersey. Gray paper cover sheet decorated with an index map listing the names of all the maps included in the atlas. Minor foxing, small tears in the margins occasionally affecting the map border.

The atlas shows counties, townships, settlements, railroads, roads, life-saving stations, light houses, etc. "From original surveys based on the triangulation of the U.S. Coast and Geodetic Survey." During the 19th Century, at various times, the State of New Jersey retained a State Geologist. After a lapse of 3 years from 1861 to 1864, "An act to complete the Geological Survey of the State" 12 passed on March 30, 1864. George Hammell Cook 1818–1889) was given the post and the charge. A former civil engineer and Rutgers professor, he had been Kitchell's assistant geologist during the 1850s survey years. In 1864, Cook also became vice president of Rutgers College; he had been instrumental in the institution's quest for land-grant status. - LeGear. Atlases of the United States, L5609; Schwartz, Seymour I. and Ehrenberg, Ralph E. The mapping of America, p. 310.

500 - 800 €

Amérique du Nord

43
SPURR, Josiah Edward.

Atlas to Accompany Monograph XXXI on the Geology of the Aspect District Colorado.

geological map
Washington, Julius Bien & Co., 1898. x mm.Original brown publisher's cloth, lettered in gilt. 27 chromolithographed maps (2 are double-page) + 1 text volume.

The atlas accompanied the monograph by Samuel Franklin Emmons (1841-1911), the head geologist in charge of the Colorado division of the United States Geological Survey. Emmons is also known for exposing the infamous diamond fields hoax in Colorado in 1872. The maps and geological cross-sections depict the topography and geology of Aspen, Tourtelotte, Hunter Park, Lenado, Aspen Mountain, and Smuggler Mountain. Includes the Aspen Special Sheet that shows the town and nearby mines.

300 - 500 €

Amérique du Nord

44
U. S. GEOLOGICAL SURVEY / WALCOTT, DOOLITLE, Ch.

Land Classification Map, New York, Mt. Marcy and Vicinity.

geological map
Washington, D.C., 1899. 910 x 665 mm.Large colour lithograph map folded in the middle. Sheet dimensions : 102 x 76 cm. Fine condition.

Map of the Adirondacks and New York State. Henry Gannett, chief topographer ; H.M. Wilson, geographer in charge ; triangulation by U.S. Coast and Geodetic Survey ; topography by E.C. Barnard .. Indicates merchantable timber, culled woods and cleared land.

300 - 500 €

Amérique du Nord

45
U.S. GEOLOGICAL SURVEY. / CLARK, W. B.

Physical atlas of Maryland Allegany County. Map of Allegany County showing the geological formations and agricultural soils / Maryland Geological Survey…

geological map
[Baltimore], Maryland Geological Survey, 1900. 600 x 500 mm.Folio. Six colored lithographed maps, loose in original wrappers, detached and slightly worn. Each map : 52 x 43 cm.Large folio atlas, cover detached and damaged. Six color lithographed maps. 52 x 43 cm each. Paper slightly yellowed.

Map of Allegany County showing the geological formations and agricultural soils produced by the Maryland Geological Survey, W.m Bullock Clark, State Geologist, in co-operation with the U.S. Geological Survey, Charles D. Walcott, Director and the U.S. Soil Survey, Milton Whitney, Director; geology by C.C. O'Harra and R.B. Rowe; soils by C.W. Dorsey. This 1:62,500 scale map was produced as part of an in-depth study of the geology and mineral resources of Allegany County, directed by State Geologist William Bullock Clark. It was published by the Johns Hopkins Press in 1900.

500 - 1000 €

Amérique du Nord

46
Geological Survey (U.S.) .

Proposed Shenandoah Valley National Park, Virginia.

geological map
1926. 890 x 700 mm.Folded in four. Fine condition.

Map showing the proposed national park in Virginia's Shenandoah Valley, scale 1:125,000, printed in 1926. The relief is represented by contours and spot heights. The process of creating Shenandoah National Park in Virginia began with several proposals and legislative actions. In 1924, the Virginia Chamber of Commerce proposed establishing a national park there to preserve the region's natural beauty and stimulate tourism. The map of the Proposed Shenandoah Valley National Park shows the park's proposed boundaries and highlights scenic roads, including the future Skyline Drive. In April 1926, the Parks Commission recommended the creation of Shenandoah and Great Smoky Mountains National Parks, and President Calvin Coolidge signed the enabling legislation on May 22, 1926. The initial area of Shenandoah National Park was to be 521,000 acres. Congress approved the creation of the park in 1926, and the park was inaugurated in 1935. The Appalachian populations and communities living in the Shenandoah Valley were displaced following the creation of Shenandoah National Park. The exodus of Appalachian populations from Virginia was part of Franklin D. Roosevelt's New Deal policies to create more jobs during the Great Depression. New Deal programs (including the Civilian Conservation Corps) helped develop roads and infrastructure. The displacement of Appalachian communities in Virginia between 1930 and 1940 was a tragedy for the communities affected. The Southern Appalachian National Park Committee played a key role in evaluating potential park sites. Meanwhile, the Commission for the Creation of a National Park in the Blue Ridge Mountains was appointed by the US Secretary of the Interior in February 1924 to identify a suitable site for a new national park in the Southern Appalachians. The committee brought together park planners, foresters, and scientists to identify an area easily accessible from the East Coast and with sufficient natural qualities to be protected. After extensive study, the committee recommended the northern Blue Ridge Mountains (Virginia) as the optimal location, in part because it met the National Park Service's criteria for a new park. This important selection marked the official start of the process that would eventually lead to the acquisition of land, the expropriation of homes, and ultimately the creation of the park. - Library of Congress : G3882.S5 1926 .G4

300 - 500 €

Amérique du Nord

47
GEOLOGICAL SURVEY (U.S.).

Proposed Great Smoky Mountains National Park, North Carolina-Tennessee.

geological map
U.S. Geological Survey, 1926. 610 x 750 mm.Fine example.

U.S. Government Mapping in the Smoky Mountains. In 1926, the same year that Congressional approval of the concept of a park allowed private fundraising to begin, the USGS produced an outstanding topographic map of the "Proposed Great Smoky Mountains National Park, North Carolina-Tennessee" at a 1:125,000 scale. It was based on the surveys done for earlier maps. The map shows the topography of the area by using contour lines at two hundred foot intervals. The area proposed for the park is outlined in red. Proposed Great Smoky Mountains National Park, North Carolina-Tennessee. 1926. The Geological Survey also published a large-scale set of maps of the proposed park between 1926 and 1931, including an index map . At a scale of 1:24,000, with twenty foot contour lines, these maps were extremely detailed and were probably used for planning purposes and to record the complex land purchases the park required. This set of maps was drawn at a scale that was very unusual for the time. It was not until 1950 that the primary USGS map product adopted this scale for the 7.5-minute topographic quadrangles replacing the earlier smaller-scale maps. The need for these maps was undoubtedly generated by the many obstacles to creating a park in the Smoky Mountains that persisted even after Congress approved a plan for the park. In addition to opposition from some local residents and long-established mining and lumbering interests in the area, there was the larger problem of financing. Unlike the western national parks, which were carved out of the public domain, the land for this park would have to be purchased from thousands of owners who held more than sixty-six hundred tracts of land. The initial plan required that all of the funding be raised independently of the federal government. The amount of funds that had to be raised was considerable. Lumber companies, reluctant to sell their land, raised the price per acre of their holdings, which included many of the most beautiful sites designated for the park. Even though the 1926 legislation authorized the purchase of lands in Tennessee and North Carolina which would then be deeded to the federal government for the park, no authority was given to the states to condemn land. Property obtained for the park had to be purchased from owners willing to sell, and was often offered at an inflated price. By the spring of 1926, groups in each of the two states had raised more than $1,000,000. The North Carolina and Tennessee legislatures each donated approximately $2,000,000. With $5,000,000 in available funds, the advocates of the park began buying parcels of land. When the prices demanded for some of the most scenic parcels, including upper Greenbrier, Mt. Guyot, Mt. LeConte, the Chinmeys, and a side of Clingman's Dome owned by the Champion Fibre Company, far exceeded available resources, John D. Rockefeller Jr. Donated an additional $5,000,000 in memory of his mother, through the Laura Spelman Rockefeller Memorial Fund. Today a marker at Newfound Gap, on the boundary between North Carolina and Tennessee, commemorates his generous gift. In U.S. Government Mapping in the Smoky Mountains: USGS and the TVA In 1926, the same year that Congressional approval of the concept of a park allowed private fundraising to begin, the USGS produced an outstanding topographic map of the "Proposed Great Smoky Mountains National Park, North Carolina-Tennessee" at a 1:125,000 scale. It was based on the surveys done for earlier maps. The map shows the topography of the area by using contour lines at two hundred foot intervals. The area proposed for the park is outlined in red. Proposed Great Smoky Mountains National Park, North Carolina-Tennessee. 1926. The Geological Survey also published a large-scale set of maps of the proposed park between 1926 and 1931, including an index map . At a scale of 1:24,000, with twenty foot contour lines, these maps were extremely detailed and were probably used for planning purposes and to record the complex land purchases the park required. This set of maps was drawn at a scale that was very unusual for the time. It was not until 1950 that the primary USGS map product adopted this scale for the 7.5-minute topographic quadrangles replacing the earlier smaller-scale maps. The need for these maps was undoubtedly generated by the many obstacles to creating a park in the Smoky Mountains that persisted even after Congress approved a plan for the park. In addition to opposition from some local residents and long-established mining and lumbering interests in the area, there was the larger problem of financing. Unlike the western national parks, which were carved out of the public domain, the land for this park would have to be purchased from thousands of owners who held more than sixty-six hundred tracts of land. The initial plan required that all of the funding be raised independently of the federal government. The amount of funds that had to be raised was considerable. Lumber companies, reluctant to sell their land, raised the price per acre of their holdings, which included many of the most beautiful sites designated for the park. Even though the 1926 legislation authorized the purchase of lands in Tennessee and North Carolina which would then be deeded to the federal government for the park, no authority was given to the states to condemn land. Property obtained for the park had to be purchased from owners willing to sell, and was often offered at an inflated price. By the spring of 1926, groups in each of the two states had raised more than $1,000,000. The North Carolina and Tennessee legislatures each donated approximately $2,000,000. With $5,000,000 in available funds, the advocates of the park began buying parcels of land. When the prices demanded for some of the most scenic parcels, including upper Greenbrier, Mt. Guyot, Mt. LeConte, the Chinmeys, and a side of Clingman's Dome owned by the Champion Fibre Company, far exceeded available resources, John D. Rockefeller Jr. Donated an additional $5,000,000 in memory of his mother, through the Laura Spelman Rockefeller Memorial Fund. Today a marker at Newfound Gap, on the boundary between North Carolina and Tennessee, commemorates his generous gift. In 1931, two years before the federal government contributed the final $2,000,000 needed to complete the land purchases, the USGS published another map of the park at a scale of 1:125,000. Although this edition of the map is not part of the Library of Congress map collections, the map was reprinted without revision in 1978, as it appears here. A map based on surveys conducted between 1927 and 1931 was published by the USGS in two sheets in 1934. It was drawn at a scale of 1:62,500. The set of maps produced by the USGS between 1926 and 1931 at the 1:24,000 scale is closely related to later maps of the areas surrounding the park and completed the quadrangle mapping to the park. The data on the set of maps showing areas inside the park were eventually integrated with data on base maps showing areas outside the park to make the first complete topographic quadrangle maps of the park and its vicinity.1931, two years before the federal government contributed the final $2,000,000 needed to complete the land purchases, the USGS published another map of the park at a scale of 1:125,000. Although this edition of the map is not part of the Library of Congress map collections, the map was reprinted without revision in 1978, as it appears here. A map based on surveys conducted between 1927 and 1931 was published by the USGS in two sheets in 1934. It was drawn at a scale of 1:62,500. The set of maps produced by the USGS between 1926 and 1931 at the 1:24,000 scale is closely related to later maps of the areas surrounding the park and completed the quadrangle mapping to the park. The data on the set of maps showing areas inside the park were eventually integrated with data on base maps showing areas outside the park to make the first complete topographic quadrangle maps of the park and its vicinity.

500 - 700 €

Amérique du Nord

48
MATTHES, François E. and EVANS, Richard T.

Topographic map of the Grand Canyon National Park Arizona.

geological map
U.S. Geological Survey, 1927. 1060 x 940 mm.Map in two sheets (West and East parts), each folded in four. Fine condition.

This topographic map, published by the US Geological Survey in the polyconic projection, exemplifies early efforts to accurately document the geography of Grand Canyon National Park. Produced for the 1927 edition, this detailed, large-scale map—based on surveys by Matthes and Evans—demonstrates early 20th-century precision in capturing the Grand Canyon's terrain for future use and reference. Combining polyconic projection and North American datum, the map embodies the cartographic techniques of its time, aiming to create a definitive topographic resource for navigation and geology, and reflecting evolving standards through explicit elevation adjustment instructions. As a historical document, this map offers insight into the methods of surveying and map-making during a period when such activities were critical for exploration and the subsequent development of national parks. The map’s utility lies in its ability to accurately convey the Grand Canyon's complex terrain —an essential feature for both historical and contemporary users. - Library of Congress : G4332.G7 1948 .G41 TIL

500 - 1000 €

Amérique du Nord

49
CHEVALIER, Michel.

Histoire et description des voies de communication aux États-Unis et des travaux d'art qui en dépendent. [Atlas seul].

geological map
Paris, Charles Gosselin 1840-41.. 550 x 372 mm.Folio atlas only, missing the 2 text volumes. Wrappers slightly browned and worn.

Atlas featuring 19 double-page engraved maps and plans that vividly illustrate railroads and engineering designs. CHEVALIER, Michel (1806-1879). When Chevalier was sent to America by the French government in 1833, he was a prominent economist seeking to analyze the newly built communication routes. His work lasted nearly two years, during which time he recorded the early observations on American transportation which are here published. His Histoire contains descriptions of various railroads, canals, and major bridges along the eastern seaboard and in the St. Lawrence and Great Lakes regions of Canada. The maps and plans show canals and railroads in New York, Pennsylvania, New Jersey, and Maryland, and technical plans detailing the structures of the Baltimore and Ohio Railroad cars, Schuylkill Canal, Cornwall Canal, Patapsco Viaduct, the Aquaduct Bridge on the Potomac River at Georgetown, the Morris Canal, and others. Monaghan notes that "Among his contemporaries, [Chevalier] enjoyed a reputation equal to that of … de Tocqueville and Gustave de Beaumont. He remains one of the most important French commentators on the United States." - Kress C.5134; Monaghan 425, 427; Sabin 12583.

1000 - 1500 €

Amérique du Nord

50
FREMONT, John Charles.

Map of Oregon and upper California from the surveys of John Charles Frémont and other authorities.

geological map
Washington, The Senate, 1848.. 860 x 690 mm.Lithographed map, originally folded. Outline hand color. Faint fold traces and minor foxing.

The map only, without the accompanying report, with an inset "Profile of the travelling route from the South Pass of the Rocky Mountains to the Bay of San Francisco. " The map, for the first time, filled in the details of the Great Basin. Charles Preuss drew the map. A smaller version of the map appears in President Polk's 1849 Message. Fremont's Map of Oregon and Upper California . . . is without question the most important 19th-century map of the American West. As noted by Carl Wheat, "in the history of the American West, the year 1848 is signalized by three events above all others, the discovery of gold at Sutter's Mill… the formal close of the Mexican War… which brought the cession of California and New Mexico… and the creation of the Territory of Oregon… All three events figure in the characteristic maps produced during the year, and particularly the cartographic monument of 1848, the magnificent 'Map of Oregon and Upper California'" (Wheat 49).Fremont's map was originally published to accompany Fremont's Geographical Memoir upon Upper California. The map and Geographical Memoir have a two-fold importance in history, first as contributions to geographical knowledge in the year 1848, and second as historic documents concerning Fremont's notable 3rd expedition… [The map] is a wonderfully graphic report on where the expedition of 1845-46 went and what it saw… As a contribution to cartographical knowledge, the case for the map was well put by Fremont himself: 'The map has been constructed expressly to exhibit the two countries of Oregon and the Alta California together. It is believed to be the most correct that has appeared of either of them; and it is certainly the only one that shows the structure and configuration of the interior of Upper California'" (Wheat). Schwartz calls it an "epochal" map and states that the map is the "most accurate general map of the Far West for its time" (Schwartz and Ehrenberg, The Mapping of America, 275, 278). As noted by Wheat, More than any other persons, John Charles Fremont and Charles Preuss dominate the cartography of the American West during the three years before the Gold Rush and brought a human tide surging into that land which had so long lain beyond the ken of most Americans" (Wheat, Mapping of the Transmississippi West, 523). The northern and southern borders are outlined in green, as is the border between Oregon and California and the eastern boundary of the Rocky Mountains, the South Pass and Sierra Madre. At the top of the map is an elevation profile of the route from the South Pass to San Francisco. Both the Plumas and American Rivers show areas marked "'El Dorado' or Gold Region," one of the earliest graphic announcements of the discovery of gold in California. According to Howes, this Preuss map was "not issued in all copies, if any, [of Fremont's Geographical Memoir] but [was] intended to accompany the pamphlet" (Howes F366). Graff lists a first edition copy of the Fremont work with first issue Preuss map laid-in as well as an identical copy of the map issued separately. As noted in Paul Cohen's excellent compilation of the maps of the West: "This important and beautifully drawn map became the model for many of the later gold region maps. The California portion is based on Fremont's map of 1845, but the legend 'El Dorado or Gold Rush Region' has been added along the 'Rio d. l. Plumas' (Feather River), and the 'R. d. l. Americanos' (American River), which is shown flowing out of 'Lake Bonpland' (Tahoe) The map covers the territory from the boundary of the 'British Possessions' on the north to the Mexican border on the south, and from the Pacific Ocean on the west to Fort Laramie and the "Great Plains" on the east (Wheat)."[B]y far the most accurate map of the Far West up to the time of its publication The rapidly changing political character of the West is not neglected on the map. 1848 was a milestone year for establishing United States territories and boundaries, and the recognition of these most recent developments make the map an up-to-date document. 'Oregon Territory' established by Congress on August 114, 1848, is clearly delineated, as are the boundaries with Mexico laid out by the Treaty of Guadalupe Hidalgo. Missouri Territory is also indicated, as was, for the first time on a published map, the presence of the Mormons in the Great Basin" - WC 150; Wheat 559 ; Schwartz and Ehrenberg, The Mapping of America, 275, 278

400 - 600 €

Canada

51
BOUCHETTE, Joseph.

Map of the Provinces of Canada, New Brunswick, Nova Scotia, Newfoundland, and Prince Edward Island with a Large Section of the United States and Exhibiting the Boundary of the British Dominions in North America (portion), According to the Treaties of

geological map
Sherman & Smith, New-York, 1853. 1200 x 2225 mm.Map dissected into 6 folding sheets mounted on canvas of 6 sections each. Slightly browned and dusty.

The edition published in New York in 1853; the first edition appeared in 1846. Winearls mentions two subsequent editions of the map, in 1852 and 1853. The map was engraved and printed in New York by Sherman and Smith, rather than in London by J. & C. Walker and James Wyld, as was the case for the 1831 edition. This map is an extensive revision and redrawing of Bouchette's 1831 map of Upper and Lower Canada, both on the same scale. The map is extended eastward to include all of Nova Scotia and northward to include Anticosti Island. New inset maps of the Environs of Montreal, Lake Superior, and the Niagara District are added, and the other insets of Newfoundland and British North America are thoroughly revised. The changes to the U.S./Canadian boundaries in Oregon (1846) and Maine (1842) are shown, as are the first three short Canadian railways (compared to the large number underway in the U.S.). In addition, there are many other revisions to the main map, well documented by Winearls. Copyrights are given for Canada and New York. This is the second large Canadian map drawn by Canadians that was engraved in America, after the map of the Canadas by David Taylor, 1834. (David Rumsey Map Collection).

4000 - 6000 €

Antilles

52
SAINT-CLAIRE DEVILLE, Charles.

Carte de la température des eaux à la surface de la mer des Antilles, du Golfe du Mexique et de l'Océan Atlantique…

geological map
(Paris), Impr. de F. Chardon aîné, 1852. 490 x 630 mm.Map slightly dusty and foxing.

One of the earliest maps to depict sea surface temperature in this tropical and subtropical region. It illustrates how variations in ocean temperature influence ocean currents (such as the Florida Current) and climate systems.

200 - 300 €

Colombie

53
CODAZZI, Agustin ; PAZ, Manuel Maria ; PEREZ, Felipe.

Atlas de los Estados Unidos de Colombia, Antigua Nueva Granada.

geological map
París, Tipografía y litografía de Renou y Maulde, 1865. x mm.Large folio, half cloth, green boards, gilt title on the front cover; 11 maps. Minor foxing, paper slightly yellowed, tear at the bottom of the introduction sheet.

[Atlas of the United States of Colombia, formerly New Granada, comprising the geographical maps of the States into which the Republic is divided, prepared by order of the General Government in accordance with the chorographic works of General Agustín Codazzi and other official documents. By Manuel Ponce de León and Manuel María Paz]. https://3siahc.wordpress.com/wp-content/uploads/2010/04/efrain-sanchez-3siach-2010.pdf - Efraín Sánchez Cabra : Agustín Codazzi y los primeros mapas nacionales de Colombia y Venezuela

2000 - 3000 €

Turquie

54
RUSSEGGER, Joseph.

Geognostische Karte des Taurus und seiner Nebenzweige in den Paschaliken Adana und Marasch…

geological map
Im K: K: Militärisch - geographischen Institute zu Wien, 1842. 580 x 470 mm.Folding map in 4 sections, mounted on linen, lithographed in color. Handwritten annotations.

Geognostic Map of the Taurus Mountains and their Branches in the Pashaliks (Provinces) of Adana and Marash... With manuscript annotations describing the process of color lithographic printing. The Taurus Mountains : a mountain range in Turkey forming the southeastern border of the Anatolian Plateau.

200 - 300 €

Turquie

55
ABICH, Herman.

Atlas zu den geologischen Forschungen in den Kaukasischen Ländern. II. Theil, Geologie des Armenischen Hochlandes, Westhälfte.

geological map
Wien, Alfred Holder, 1882. 660 x 410 mm.Part II. Large folio in original wrappers, with four lithographed plates. Covers heavily worn; scattered foxing and minor marginal tears.

Tome II. Set of four plates comprising color geological maps and panoramas, in varying formats. The atlas presents general maps and panoramic views explaining the volcanic and tectonic structure of the western edge of the Armenian Plateau. Hermann (Otto Wilhelm) Abich (1806–1886), geologist and mineralogist, is often referred to as the “father of Caucasian geology.” - Zentralbibliothek Zürich (cote : ZB Kartensammlung, NFF 31)

200 - 300 €

Turquie

56
KENAN, Damat / SAYAR, Ahmed Malik.

Carte géologique d'Anatolie.

geological map
Stamboul, Imprimerie impériale, 1920. 620 x 860 mm.Color lithographed folding map, 73 × 90 cm overall. With a handwritten dedication by G. Nègre to the Geological Society of France, and numerous manuscript annotations and French translations.

Geological map of Asia Minor, by Damat Kenan and Ahmet Malik Sayar. Issued and printed in 1336 Rumi Calendar. Text is Ottoman Turkish script. Includes legend, identifying geological zones, and location of mines with a color-coded key to mineral deposits. The map shows roads and railroads. This important map also bears a handwritten dedication by Georges Nègre to the Geological Society of France: ‘Tribute to the Geological Society of France in memory of a year spent in Kemalist country (1920–1921).’ Signed G. Nègre and dated June 1922. With handwritten French translations of the Ottoman text and cartographic annotations. Created during the final years of the Ottoman Empire, the map reflects the transition to the Turkish Republic. It was produced with the intention of supporting the new nation by highlighting its natural resources. The map served as a fundamental tool for scientific exploration and resource management, in line with the modernization efforts led by Mustafa Kemal Atatürk. - David Rumsey Map Collection, 132880.

200 - 300 €

Arabie

57
RABUSSON, A.

Carte du golfe Arabique des petits géographes grecs...

geological map
Paris, 1845. 565 x 770 mm.Autographed map. Scattered foxing, tear in the margin affecting the edge of the map. Volcano (top left) contemporary colored in red.

Represents the Arabian Gulf or Persian Gulf according to the knowledge of ancient Greek geographers, based on the hypothesis that placed the Sinus Arabicus of the ancients (Red Sea) south of the Aegean Sea.

200 - 400 €

Arabie

58
United States Geological Survey of the Kingdom of Saudi Arabia.

Geological maps of the Kingdom of Saudi Arabia (13 maps).

geological map
Washington, D.C., U.S. Geological Survey, 1958-1963. x mm.Thirteen color-printed maps folded in their presentation envelopes. In excellent condition. Approximate dimensions of one map: 103 × 101 cm.

A set of 13 maps from a series of twenty-one bilingual, dual-dated maps published as part of a collaboration between the government of Saudi Arabia and the U.S. Geological Survey. This project was the first to produce a complete series of geological and geographical maps of the Kingdom of Saudi Arabia and played a decisive role in its emergence as a major world power in the production of natural resources. The project supervisor was an experienced geologist, Glen F. Brown, who had first traveled to the Kingdom in the mid-1940s and had established excellent relations with Saudi officials. They asked him to renew his cooperation in 1950, which led to the formation of a team composed of Brown, geologists appointed by the Saudi Ministry of Finance and National Economy, and geologists from Saudi Aramco. Among the most prominent Aramco geologists were R. A. Bramkamp and L. F. Ramirez. Together with Glen F. Brown, who oversaw the collaboration, Bramkamp in February 1955 planned the entire program, defining everything from the map scales, areas of responsibility, and types of relief representation to the bilingual toponyms. As Aramco’s chief geologist, Bramkamp was responsible for compiling the sedimentary areas of Arabia. This responsibility was taken over by Ramirez following Bramkamp’s premature death in September 1958. The topographers divided the Peninsula into 21 quadrangular sections (numbered I-200 through I-220), each covering an area of 3 degrees of longitude by 4 degrees of latitude. All maps were produced at a scale of 1:500,000 and issued in two series: a combined map of geography and geology (marked with the annex “A”) and a geography-only map (“B”). The first geographic quadrangle was published in July 1956 and the last in September 1962. The first sheet of the geologic series was published in July 1956 and the final one in early 1964. Although ultimately motivated by the search for oil, gas, and minerals, the exploration of the Kingdom’s resources was initially driven by the vital need for water. In 1944, King ʿAbd al-ʿAzīz called upon the United States to send an expert capable of identifying and mapping natural resources, in particular groundwater reserves. Ten years later, in 1954, the Saudi Ministry of Finance, the USGS, and Aramco launched the first complete series of geographical and geological maps of the country, published in both Arabic and English. Personally supported by Ibn Saud, this project served not only resource exploration but also the development of agriculture, civil and military infrastructure. Its groundbreaking results remain the foundation of all modern cartography of the Kingdom. - James V. Parry, "Mapping Arabia", in : Saudi Aramco World 2004/1

1500 - 2000 €

Inde

59
BLANFORD, Henry Francis.

Rainfall chart of India, showing the average annual distribution of the rainfall according to locality and season.

geological map
Calcutta, 1883/January 1884. 1000 x 960 mm.Folding map in 12 sections backed on canvas. Color lithograph. Fine condition.

The introduction of scientific meteorology in India is remarkable. The British were the first to introduce organized meteorology and storm warning systems in India to serve their imperial interests. One of the most prominent British administrators and scientists who introduced scientific meteorology in India was Henry Francis Blanford. After his appointment as Honorary Secretary of the Asiatic Society of Bengal in 1864, he began detailed meteorological experiments in India. He also submitted a report on the 1864 Calcutta cyclone with the help of a colleague. In that report, he recommended installing storm-warning systems at various ports. When the Bengal Provincial Meteorological Office was established in 1867 AD, he was appointed as its Meteorological Reporter. He then undertook to form an all-India organization to collect and impose meteorological data. Finally, his personal initiative and the goodwill of the British Government led to the establishment of the Indian Meteorological Department in 1875. H.F. Blanford was appointed the first Imperial Meteorological Reporter and pioneered scientific meteorology in India. He put forward a plan to unify provincial meteorological systems into an imperial system. He also sketched out general guidelines for conducting meteorological work in India. Apart from bringing changes to the department's administrative and operational procedures, he personally wrote several research articles and books on India's weather and climate. Drawing on his intelligence and diligence, he discovered many unknown facts about India's meteorology. He examined irregularities in seasonal monsoon rainfall, the periodic recurrence of drought, and fluctuations in monsoon rainfall across the plains and foothills. In fact, he introduced the study of tropical meteorology for the first time. - International Journal of Humanities Social Science and Management (IJHSSM). Agnidev Manna "Henry Francis Blanford and the Beginning of Scientific Meteorology in India, 1874-1889" Volume 3, Issue 2, Mar.-Apr. 2023, pp: 187-192 www.ijhssm.org.

1000 - 1500 €

Chine

60
TAN, H. C.

Atlas for the geology of Szechuan province and Eastern Sikang. / Atlas for the geology of the Tsinlingshan and Szechuan.

geological map
Peiping (Pékin), 1931 et 1935. 405 x 525 mm.Oblong folio atlas, stapled and bound with orange cords; 36 single plates and 5 folding plates. Slightly loose binding, the last plate is detached. + Square folio atlas, bound with red cords, title and 17 single maps.

Set of 2 atlases published by The National Geology Survey of China: “Atlas for the Geology of the Tsinlingshan” illustrated with 17 maps, and “Atlas for the Geology of the Szechuan” illustrated with 41 maps (5 folding).

100 - 200 €

Japon

61
LYMAN, Benjamin Smith.

Geological and Topographical Maps of the Oil Lands of Japan.

geological map
1882. 1765 x 1130 mm.Monumental folding map dissected in 25 linen-backed sections. Paper slightly browned.

Important and monumental bilingual map at a scale of 1:60,000, published in 1882, devoted to the oil-producing regions of Japan. It was issued in a unique 19th-century Japanese-American collaboration spurred by the Meiji agenda to modernize, expand access to fossil fuels, and drive industrialization. It was prepared by the American geologist Benjamin Smith Lyman and a team of Japanese colleagues. The map's size, its lack of publication information, and the high level of technical detail underscore its purpose as an internal government and industrial document. The main map covers the area roughly between Nagano and Niigata, northwest of Tokyo, and the districts of Minochi, Kubiki, Kariha, Uonuma, and Mishima. This was the only region of significant oil reservoirs outside of Hokkaidō. At the bottom right is a map of Honshu, Kyushu, and Shikoku, shading the region shown on the main map and situating it within Japan. There are eight inset maps at left showing areas with less significant oil reservoirs in Ugo Province, Echigo Province, and Tōtōmi Province. At top-left are explanatory notes on the representation of sections and type of rock, while a more general legend ('Explanation of signs') sits at bottom-right. Hokkaidō and the Kaitakushi : Lyman was hired by the Japanese government in 1872 to survey areas of oil and coal deposits on Hokkaidō, then part of a northern frontier known as Ezo (often written as Yesso in Western sources). Prior to the 19th century, portions of Ezo and the Ainu people who lived there were under the loose control of feudal lords, but the size of the territory, the harshness of the climate and terrain, and the low population density meant that much of Ezo was beyond the reach of Japanese samurai and daimyo. When the Tokugawa government became concerned that Russia might seize Hokkaidō in the early 19th century, they became more interested in mapping and controlling the island. When the Tokugawa fell, the Meiji government, even more aware of Japan's gap with Western powers, quickly imported foreign experts, including Lyman, to help develop mining and agricultural colonies on Hokkaidō. The island proved to be a source of resources essential to Japan's industrialization, including coal, timber, and arable land. The Hokkaidō Development Commission (Kaitakushi) organized these efforts and brought in tens of thousands of migrants from other parts of Japan in a race to colonize it before it could be claimed by Russia. These measures had the desired effect, but were devastating for the Ainu of Hokkaidō, who were forcibly assimilated and lost much of their traditional culture. During his long stay on Hokkaidō, Lyman, who was something of an amateur anthropologist of the Ainu, regularly worked with the Kaitakushi, though their relations were often strained. Lyman and the Geological Survey of Japan Lyman had already left Japan by the time this map was produced, but he and his Japanese colleagues had spent much of the previous decade surveying and writing reports about the allocation of fossil fuels and other natural resources in Japan, particularly Hokkaidō. Lyman's Japanese collaborators, including those involved in this map's production, were the first generation of Japanese geologists and natural resource surveyors trained in modern methods. They were instrumental in forming the Geological Survey of Japan in 1878 as an office in the Ministry of Home Affairs. Lyman encouraged the group's founding and donated his home as their headquarters when he left Japan in 1879. Benjamin Smith Lyman (December 11, 1835 – August 30, 1920) was an American mining engineer, geologist, surveyor, and scholar in several fields, including Asian cultures and languages. After graduating from Harvard with a law degree, Lyman went to work with his uncle, who was the Director of the Geological Survey of Pennsylvania. His interest piqued, Lyman continued to work on geographic surveys in the United States, Europe, and eventually Asia. Lyman was hired by the Japanese government to survey Hokkaido with Japanese colleagues, who later formed the Geological Survey of Japan. Lyman stayed in Japan for six years and published several works on the Japanese language and Japanese culture. After returning to the U.S., he maintained an active scholarly life, publishing works about Japan, geology, moral philosophy, and vegetarianism, among other topics. Geological Survey of Japan (1878 - present) was originally an office within the Japanese government's Ministry of Home Affairs and later other government ministries before becoming an independent organization (in 2001. It its early years, it played an important role in developing Japan's energy resources during the crash course of modernization during the Meiji era. It focused in particular on resource-rich Hokkaido (then known as Ezo, a term referring to Japan's entire northern frontier) and was closely affiliated with the Hokkaidō Development Commission (Kaitakushi).

1000 - 1500 €

Japon

62
ASONUMA, J.

Topographical map of Hokkaido with localities of useful minerals.

geological map
Hokkaidōchō (Gouvernement de Hokkaidō), Sapporo, 1891. 380 x 560 mm.Folding color lithographed map, mounted on linen.

English–Japanese bilingual topographical map (1:1,500,000) of the island of Hokkaidō, detailing the distribution of mineral deposits and mining sites (“useful minerals”), issued by the Hokkaidō Government during the late-Meiji mining boom. It is associated with Jimbo Kotora’s general geological map of Hokkaidō (Hokkaidō Government edition).

100 - 200 €

Japon

63
ASONUMA, J.

Mountain system of Hokkaido.

geological map
Hokkaidōchō (Gouvernement de Hokkaidō), Sapporo, 1892. 380 x 550 mm.Folding color lithographed map, dissected into six linen-backed sections. Paper slightly browned.

Bilingual English–Japanese map of Hokkaido showing elevations, volcanoes, and routes for geological observations, with an inset of Chishima (Kuril Islands).

100 - 200 €

Japon

64
HARADA, T. / FESCA, Max.

Japanese Islands /Systems of mountains and rivers.

geological map
(1889). 510 x 420 mm.Folding map in four sections mounted on canvas, lithographed in color.

This map is considered the first national geological and geographical thematic map of Japan, or at least one of the earliest to combine relief and hydrography on a national scale. It includes a large inset at upper left showing Hokkaido. Drawn at a scale of 1:3,100,000 (i.e., 1 cm = 31 km), it employs contour lines with 500-meter intervals and auxiliary contours every 100 meters. The map forms part of the Meiji-era government’s scientific modernization project, through which the government sought to systematically map the territory and better understand its natural resources. The title, “Systems of Mountains and Rivers,” indicates that the focus lies not only on topography (mountain ranges) but also on hydrological networks, the map highlights the major river basins, waterways, and their relationship to the terrain.

100 - 200 €

Australie

65
GSV / SELWYN, A. R. C.

Geological Survey of Victoria.

geological map
Mining and Geological Department, Melbourne, ca. 1864. 510 x 765 mm.Large oblong folio atlas illustrated with 54 color lithographed maps printed on a mechanical steam lithographic press (Lithographic Steam Printing Executed by the Geological Survey Department, at the Gov.t Printing Office, Melbourne), mounted on thick paper; with one large folding linen-backed map in color (114 × 170 cm), and 8 unbound maps (46 × 71 cm) inserted in a pocket affixed to the inside front cover. Half green grained leather with corners. Binding worn, upper joint split, spine damaged.

Atlas containing all the geological maps of the province of Victoria (Australia), which was exhibited at the Paris Universal Exposition of 1867 under the title “Geological Survey of Victoria,” and which was presented to the Geological Society of France by the director of the Corps of Geological Engineers, Mr. Alfred R. C. Selwyn, of Melbourne. The portfolio first contains a large general geological map of the entire province of Victoria, at the scale of 8 miles per inch, providing an overview of the main geological divisions of this vast country; then there is an index map indicating the progress made up to April 30, 1864; and finally, 51 sheets of the map, at the considerable scale of two inches per mile. Several of the sheets include geological cross-sections, and all contain detailed explanations on geology and mining. "This colony, whose name did not even exist twenty years ago, and which was at first known only from a few travelers’ accounts around the world as a place of exile for convicts, under the name of Port Phillip, and which today still has fewer than 700,000 inhabitants; this antipodean country," adds Mr. Marcou, "maintains a staff of fifteen geological or mining engineers, at an annual cost of one hundred to one hundred and twenty thousand francs, with an entire establishment of museums, courses, workshops for map draftsmen, and the publication of reports, statistics, and mineral assays." [Jules Marcou]. Jules Marcou: Franco-American geologist and cartographer, president of the Geological Society of France in 1865. Alfred Richard Cecil Selwyn (26 July 1824 – 19 October 1902) was a British geologist and public servant, director of the Geological Survey of Victoria from 1852 to 1869. In 1852 the Colonial Office appointed Selwyn director of the Geological Survey of the recently founded colony of Victoria, where he built up an excellent staff including Richard Daintree, C. D. H. Aplin, Charles Smith Wilkinson, Reginald Murray, Edward John Dunn, Henry Yorke Lyell Brown and Robert Etheridge, Junior, with Sir Frederick McCoy as palaeontologist. He was a strict disciplinarian and from the beginning set a very high standard of work in his department. During his 17 years as director, over 60 geological maps were issued which were among the best of their period: they were models of accuracy which established a tradition of geological mapping in Australia. Selwyn was well qualified to analyse the Silurian strata. He was also responsible for several reports on the geology of Victoria and added much to the knowledge of gold-bearing rocks. Selwyn discovered the Caledonian goldfield near Melbourne in 1854 and in the following year reported on coal seams in Tasmania, until in 1869 the Colonial Legislature brought the Survey to an abrupt termination on economic grounds.

5000 - 7000 €

Australie

66
COUCHMAN, Th.s / SMITH, Collard.

Victoria Geologically colored.

geological map
Melbourne, Mining Department, 1880. 1160 x 1740 mm.Folding map divided into 32 segments, mounted on linen in two sheets. In good condition.

Victoria Geologically colored under the superintendence of Tho.s Couchman Secretary for Mines and Chief Mining Surveyor for the Colony of Victoria ; published by the direction of the Hon. W. Collard Smith M. P. Minister of Mines Mining Department Melbourne. Drawn by G. A. Windsor, engraved by William Slight, under the direction of A. J. Skene [...], geologically colored by Arthur Everet. This map was an early attempt to provide a comprehensive picture of Victoria’s geology. Based on existing GSV mapping - overlaid on the framework of Selwyn’s 1863 map of the colony - it represents a report on the Geological Survey’s progress to 1880. The ‘blobby’ and imprecise boundaries between different rock types in eastern Victoria indicate a lack of detailed mapping for that inaccessible part of the colony.

300 - 500 €

Australie

67
EVERETT, Arthur. / Victoria. Department of Mines.

Victoria.

geological map
Melbourne, Department of Lands and Survey, Melbourne, 1902. 1140 x 1700 mm.Large coloured map in eight unjoined sheets, each measuring 69 × 56 cm. Some tears along the sheet edges.

Geological map of the State of Victoria (Australia), compiled and coloured by Arthur Everett for the Department of Mines. Surveyed and engraved by the Department of Lands and Survey, Melbourne, this map was printed in colours by Government Printer, Robt. S. Bain. It shows the principal geological formations, tectonic structures, gold- and mineral-bearing zones, the hydrographic network, and the main communication routes.

300 - 500 €

Australie

68
SCRIVENER, Charles Robert.

Canberra Contour Survey.

geological map
Department of Lands, Sydney N.S.W. July, 1909. 1008 x 755 mm.Large vertical tear extending the full height, browning, repaired. With folds as issued.

Charles Scrivener’s important, large-scale contour map of present-day Canberra was prepared for the proposed federal capital. The map bears a printed signature by Charles Robert Scrivener, 22nd May 1909. Charles Robert Scrivener (1855-1923) Scrivener was a surveyor, born at Windsor, New South ales. He was an accountant at Orange in 1875 before joining the New South Wales Department of Lands as a cadet ‘geodetic computer’ in the trigonometrical branch (1876). From 1891, he carried out the re-survey and definition of the boundaries of the Gloucester estate of the Australian Agricultural Co. and in 1896, he was acting district surveyor of the Wagga Wagga district, which included the southern Monaro. Scrivener’s surveys in rugged country established his reputation as an extremely able bushman.However, he is best known for his association with the Federal capital site selection. Influenced by the Snowy River ‘surplus overflow’, Alexander Oliver had recommended Bombala, with sea access at Eden, as the best prospect for Australia’s capital city. For two months during the winter of 1904 Scrivener and an assistant worked on horseback in snow-covered country to prepare contour maps, drawn in a tent on rough drawing-paper by Scrivener, with such accuracy that the Land Department swiftly published 4000 copies. His reports proved vital to the choice of Dalgety. Scrivener next marked out prospective territorial boundaries but on his own initiative added 1550 sq. miles (4015 km²) taking in the Snowy River watershed including Mount Kosciusko. In an angry response (Sir) Joseph Carruthers withdrew the Dalgety site and threatened High Court action if a single Commonwealth survey-peg was driven into New South Wales soil. Scrivener served in Hay as district surveyor in 1906-08, and engaged in cadastral surveys in the Deniliquin district. Following Commonwealth acceptance in December 1908 of a capital in the Yass-Canberra district, Andrew Fisher chose Scrivener in preference to the New South Wales chief surveyor to determine the best city site and water-catchment territory. Scrivener forced a small team on a sixteen-hour day schedule to complete the task within two months. He again triggered prime ministerial correspondence and New South Wales hostility by suggesting a boomerang-shaped territory of 1015 sq. miles (2630 km²) determined by the Cotter, Queanbeyan and Molonglo river catchments. Despite negotiation of alternative territory, Scrivener’s recommendation for a city in the Canberra valley with railway access to Jervis Bay was accepted. His survey was the basis of the competition forthe design for the capital city. In 1910 Scrivener was appointed first director of Commonwealth lands and surveys. He established the land survey and property branch of the Department of Home Affairs and concentrated on the topographical, cadastral, triangulation and railway surveys connected with city planning and land purchase, until he and his staff were posted to Melbourne in 1914. He retired in 1915, having been appointed I.S.O. in 1913.

300 - 500 €

Australie

69
BROINOWSKI, F. J. / SCRIVENER, Ch.

Map of contour survey of the site for the federal capital of Australia.

geological map
Department of Lands, Sydney, 1910. 1330 x 1360 mm.Large chromolithographed folding map, mounted on linen. Original folds.

Depicts the Canberra region (the site for the future Federal Capital of Australia) in New South Wales. This map was published when the Commonwealth of Australia was searching for a site for its federal capital (in 1908, the site near Canberra was selected). The topographic survey was essential for future planning, urban development, and infrastructure. It provides a record of the natural landscape and terrain before the major urban transformations that the site would later undergo. Charles Robert Scrivener (2 November 1855 – 26 September 1923) was an Australian surveyor who surveyed numerous sites in New South Wales.

200 - 300 €

Australie

70
Department of Lands, Sydney.

Topographical map of the Federal Territory, Australia.

geological map
Sydney, Dept. of Lands, 1910. 1250 x 870 mm.Large map printed in colors, mounted on linen and folded in four.

This map, published by the Department of Lands of New South Wales in Sydney in 1910, depicts the Federal Territory, the area created to host the future federal capital of Australia, now the Australian Capital Territory, in the Canberra region. Produced at the time when the Commonwealth of Australia was preparing to establish its capital, it served as the official cartographic base for the urban planning competition launched to design the plan for the new federal capital. The competitors used this map to study the site's relief, waterways, and topography before submitting their development proposals.

200 - 300 €

Australie

71
Department of Lands, Sydney NSW.

Map of part of New South Wales Australia shewing position of Commonwealth Territory / Map of New South Wales Australia…

geological map
Department of Lands, Sydney NSW, 1911. x mm.Two maps printed in black and red: one large map (55 × 66 cm) and one smaller (36.5 × 45 cm). Overall in good condition. "Commonwealth Territory shewn by red tint, Federal City within Territory uncolored".

Two maps illustrating the region of New South Wales and the area designated as the future Commonwealth Territory (later the Australian Capital Territory). The first map indicates the location and boundaries proposed for the Federal Territory; the second provides a broader overview of the colony/state of New South Wales with principal towns, rivers, railways, and administrative divisions. Both maps were produced under the authority of the Department of Lands, New South Wales at the time of the formation of the Commonwealth of Australia (1901).

200 - 300 €

Australie

72
TALBOT, H. W. B.

Topographical map of Meekatharra.

geological map
Perth, Geological Survey of Western Australia, 1911. 980 x 470 mm.Large lithographed map. Numerous tears, as is.

Topographical map of Meekatharra with an inset : Locality plan. A topographical field map depicting the region of Meekatharra, in the State of Western Australia, within the Murchison region, an area of extensive gold-mining activity. It likely served as a cartographic and scientific base for the geological and mining analysis of the Meekatharra district, which constitutes an important historic goldfield (including the Paddy’s Flat and Bluebird deposits). The map also shows the boundaries of mining leases, the gold-extraction zones, and the principal mining sites. The topographical and geological surveys were carried out as part of the Geological Survey of Western Australia's work, intended to document and regulate mining activity. "Note - a second edition containing geological information will appear later."

200 - 300 €

Australie

73
ANDREWS, E.C., Department of Mines.

Geological Map of the Sydney District. / Map of the Sydney District - Geological Structure Contours.

geological map
Alfred James Kent, Government Printer, 1925. 820 x 630 mm.Large color printed map + 1 map on transparent paper that overlaps the previous one. 10 cm tear along the center fold, 2 small angular losses with slight loss in the map.

Geological map of the Sydney district. Scale: 2 miles to 1 inch. Prepared under the direction of E.C.Andrews, Department of Mines, NSW. Although geological observations had been made in the Sydney District in the early part of the 19th Century, the first systematic work in this field was published in 1867, when Rev. W. B. Clarke published his ‘Remarks on Sedimentary Formations in New South Wales’. Wilkinson, David, Etheridge, Curran, and others added to this knowledge before 1900; and all later workers owe a special debt to these pioneers, most of whose surveys were carried out under primitive conditions of access and transport. Since 1900, Came's memoirs on kerosene shale deposits (1903) and the Western Coalfield (1908), and Willan’s Geological Map of the Sydney District (1925) have covered large parts of the Sydney Sheet.

200 - 300 €

Australie

74
COULTER, R. Charles G.

Cycloramic view of Canberra capital site, view looking from Camp Hill / … view looking from Vernon.

geological map
Sydney, John Sands, [1911]. 241 x 5100 mm.Two-sheet panorama, unjoined, each 2.55 m long. Very large colour photo-mechanical print. Traces of vertical folds.

Reproduction of a watercolour showing an extensive panoramic view of the site of Canberra with various features named. Very large colour photo-mechanical print. Printed by John Sands Ltd [Syd]. This large print, intended to promote or illustrate the development project for the site, reflects the interest in the topography and planning of the new capital during the early decades of the 20th century. R. Charles G. Coulter (1864–1956). W.L. Vernon, Govt. Architect.

300 - 400 €

Europe

75
MARTONNE, Emmanuel de.

Travaux du Comité d'études. Tome II. Questions européennes.

geological map
Paris, Service géographique de l'armée, 1919. 540 x 428 mm.Folio cardboard binding ; table of contents and 21 heliogravure maps in sheets, most in color.

The Committee of Studies was established by decree in 1917 to assist in preparing the peace negotiations following the war. Volume II addresses European territorial and border questions, comprising documented files, reports, and maps prepared to inform the negotiators.

100 - 200 €

Îles Britanniques

76
Geological Survey of the United Kingdom.

Geological Survey of the United Kingdom (Great Britain, Ireland).

geological map
Geological Survey of Great Britain, 1867. 700 x 1200 mm.Four large oblong plano volumes and one oblong folio volume. 
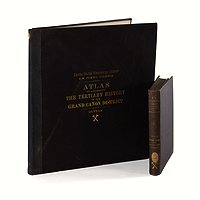
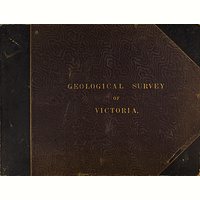
Half black grained sheep binding with corners, boards covered in green percaline cloth, spine with five raised bands richly decorated with gilt vegetal motifs, gilt fillet framing the half binding and corners, all edges gilt. A large gilt title and the motto of the British monarchy, "Dieu est mon droit" and "Honi soit qui mal y pense" (Order of the Garter), stamped in gold on the upper cover. Spines, corners, and edgeslightly rubbed ; percaline of the upper board of one Great Britain volume torn and partially detached. 
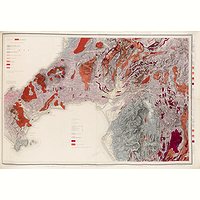
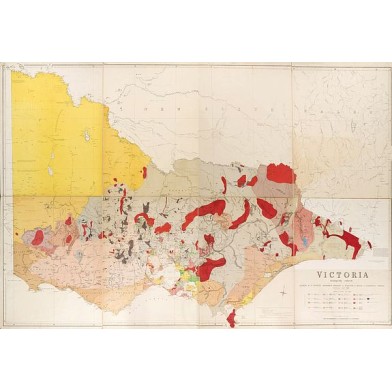
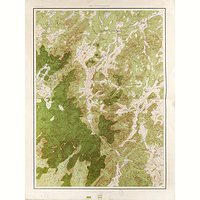
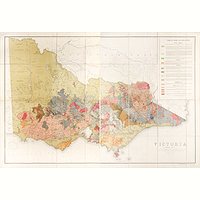
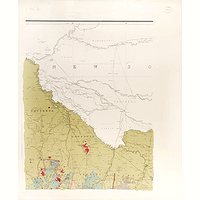
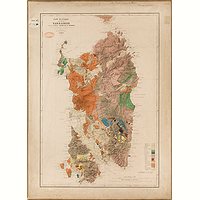
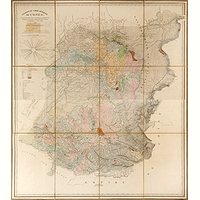
All the maps are sumptuously and meticulously hand-colour The colours are numerous, vivid, and exceptionally fresh ; some maps are heightened with gold and white.

Geological Survey of Great Britain. Monumental set of five volumes (Exposition Universelle, Paris 1867). A large gilt title and the motto of the British monarchy, "Dieu est mon droit" and "Honi soit qui mal y pense" (Order of the Garter), stamped in gold on the upper cover. The colours are numerous, vivid, and exceptionally fresh ; some maps are heightened with gold and white. This rich palette of colours was intended to enhance the legibility and visual clarity of the geological maps. 
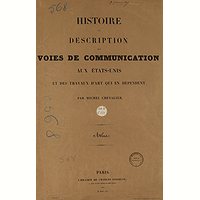
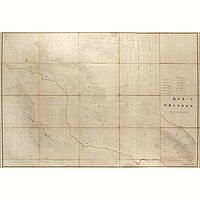
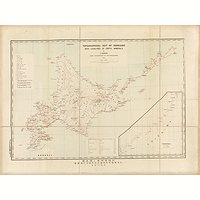
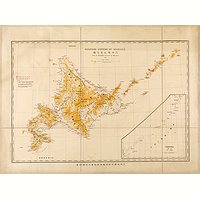
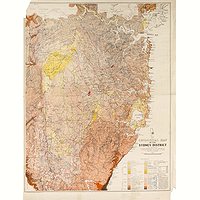
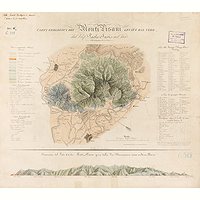
A set of five volumes of geological maps and sections, published by the Geological Survey of Great Britain under the direction of Sir Roderick Impey Murchison, and exhibited at the Exposition Universelle of 1867 in Paris, within the Palais du Champ-de-Mars. 
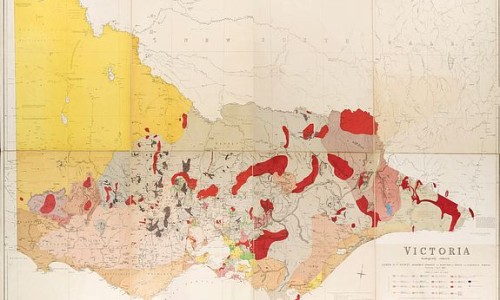
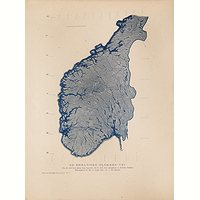
The collection covers England, Wales, Scotland, and Ireland, describing the geological formations, stratigraphic structures, and mineral resources of the United Kingdom in the nineteenth century. At that time, the French geologist Jules Marcou wrote an extensive commentary on this monumental work. Composition of the Atlas. The map of the British Isles is organised as follows : 
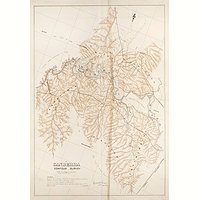
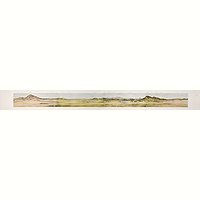
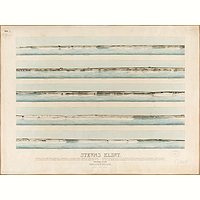
Three volumes "Great Britain" - two containing maps and one of geological sections (68 sections and 28 geological plates of coal fields) ; two scales are used: “One Inch to One Mile” (75 maps + index) and “Six Inches to One Mile” (40 maps). Two volumes "Ireland" - one large plano volume of geological sections (20 sections + 1 geological coal-field plate) and one oblong folio volume containing 106 maps. 
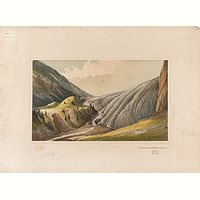
This monumental scientific publication is equally remarkable for its artistic quality and its use of colour. Each plate is a true work of art."The colouring of the maps, as well as that of the longitudinal sections, is done entirely by hand; thus all these geological maps are much easier to read, clearer, and better executed than those printed in colour. Moreover, this hand-colouring allows for additions and corrections, which become very difficult when the colouring is printed, for then one must alter an entire system of lithographic or typographic plates; whereas here it is enough to cut out the modified part of the sheet and paste over it the corrected portion, coloured by hand." (Jules Marcou). In the nineteenth century, the United Kingdom undertook an unprecedented scientific enterprise : to produce a complete geological atlas of the British Isles. Directed by the Geological Survey, the project was impressive both in scope and execution. At the 1867 Exposition Universelle, visitors admired immense portfolios of hand-coloured maps, cross-sections, and vertical profiles, accompanied by detailed indexes and explanatory legends. 
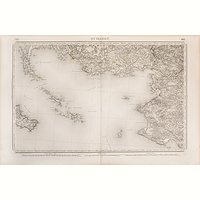
The atlas gradually came to cover England, Wales, Scotland, and Ireland, using two scales : a large scale (Six Inches to the Mile) for local detail, and a smaller scale (One Inch to the Mile) for broader regional depiction. 
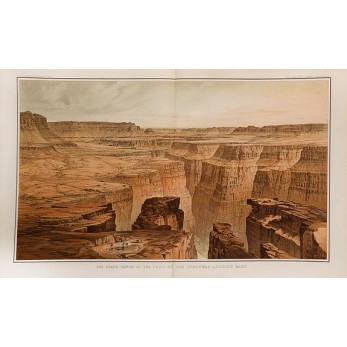
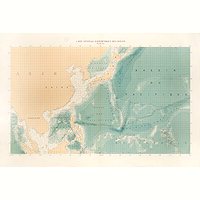
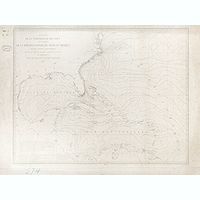
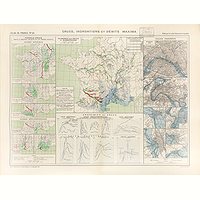
The cross-sections reveal faults, folds, and str, often inferred through geological reasoning, while the vertical sections accurately indicate the thickness of the layers. Because they were entirely hand-coloured, the maps were both clear and aesthetically refined, and could be easily revised when new discoveries occurred. This flexibility proved invaluable, for example, when the Rhaetic formation was reclassified in 1864, requiring the revision of several sheets already issued. Thanks to this method, the Atlas advanced rapid : within ten years, more than sixty new maps were published, bringing the total to 113 sheets for Great Britain, covering the whole of Wales and a large part of England, while work on Scotland and Ireland also progressed. Ireland already included 102 maps and about twenty large sections, though its northern regions remained to be surveyed. 
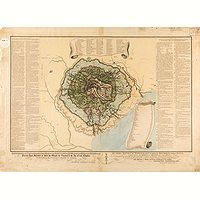
The chromatic code of the Atlas was exceptionally rich, over 130 tints and shades distinguished the various formations. Every subdivision, even local, was recorded, reflecting the diversity of the terrain and the continuity of geological time. Each map was accompanied by descriptive memoirs, detailed indexes, and scientific commentaries documenting the progress of publication. To encourage dissemination, each sheet was sold separately at a modest price, ensuring wide circulation, in some years, over 5,000 copies were sold, a sign of the popularity of geology in Victorian Britain. Three major museums, in London, Dublin, and Edinburgh, were associated with the project, gathering fossils, rocks, and minerals. A Royal School of Mines trained engineers and strengthened ties between research and industry . At the head of the enterprise, Sir Roderick Impey Murchison coordinated around fifty geologists and palaeontologists, divided into English, Scottish, and Irish branches. The resources were considerable, nearly £20,000 in 1867, far exceeding the budgets of most other European surveys. Each year, an official report recorded progress, sales, discoveries, and methodological innovations. To Jules Marcou, a keen observer, this vast undertaking represented the ideal model of geological cartography. More than a scientific record, the Atlas became a national monument, a mirror of the British soil and its geological history, destined to inspire other nations. Jules Marcou (1824 – 1898 ) 
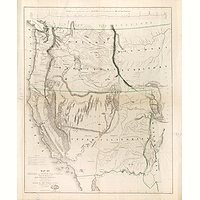
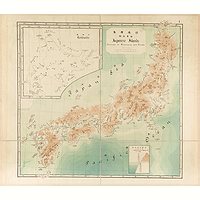
Born on 20 April 1824 in Salins-les-Bains (Jura) and deceased on 17 April 1898 in Cambridge (Massachusetts), Jules Marcou was a French geologist best known for having published the first geological map of the United States in 1855. 
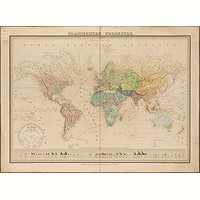
He joined the Société géologique de France in 1845 and, a few years later, produced the second geological world map in 1861. Renowned for his independence and outspokenness, Marcou was a passionate yet sometimes controversial figure within the geological community.

10000 - 15000 €

Italie

77
GEMMELLARO, Giuseppe.

Historical and topographical map of Etna from the era of the Sicani to the present time, intended to show the origin, the direction and age of each eruption.

geological map
London, James Wyld, February 1st 1828. 440 x 690 mm.Double page map. Foxing, tears in margins reinforced with adhesive tape, split in the lower part, dusty paper.

With flanking descriptive text in English and Italian. Scale 1: 20,000

150 - 200 €

Italie

78
SAVI, Paolo.

Carta geologica dei Monti Pisani levata dal vero.

geological map
1832. 480 x 550 mm.Engraving in period colors. Stains, tears in lower margin repaired with tape, slight foxing.


150 - 200 €

Italie

79
DELLA MARMORA, Alberto.

Carte géologique de l'Ile de Sardaigne. / Carta della Sardegna

geological map
Turin, 1856. x mm.


100 - 150 €

Italie

80
FABRI, Antonio.

Relazione sulle miniere di ferro dell'isola d'Elba…Atlante.

geological map
Roma, Tip. Nazionale, 1887. 505 x 470 mm.Folio atlas only, in bound cardboard covers. 9 lithographed plates in color (6 maps and geological profiles), complete. A fine copy.

The atlas, illustrated with 6 maps and 3 plates of geological profiles, is an appendix to Vol. III of the Memorie descrittive della Carta Geologica d’Italia. It is significant for the history of geology and mining in Italy, particularly for the study of iron in Tuscany. It includes maps and cross-sections that illustrate the internal structure of mineral and metalliferous formations.

200 - 300 €

Italie

81
PORRO, Carlo et LABUS, Pietro.

Atlante dei Ghiacciai italiani. Parte Prima. Carta Corografica.

geological map
Ist. Geografico Militare, Firenze, 1927. 470 x 530 mm.Folio in wrappers, containing 4 maps.

Carta Corografica, scale 1:500,000. Published by the Comitato Glaciologico. Map in four sheets forming the large chorographic map of Italy. Provides an overview of the distribution of Italian glaciers in the Alpine and Apennine ranges. It was intended to complement the 1925 Italian glacier survey and to serve as a basis for detailed maps (at a scale of 1:25,000) for each glacial region.

100 - 200 €

Italie

82
ABICH, H.

Atlas zu den Geologischen Beobachtungen über die vulkanischen Erscheinungen und Bildungen in Unter- und Mittel-Italien… Erste Lieferung.

geological map
(1841). 450 x 600 mm.Oblong folio fascicle, stitched in wrappers. 5 lithographed plates.

First fascicle. Illustrated with five geological plates of volcanic phenomena in various formats, including three maps and two views (Naples, Vesuvius, Krater von Roccamonfina, etc.). Between 1833 and 1834, Abich undertook several scientific journeys in southern and central Italy, notably to Vesuvius, Etna, and the Aeolian Islands; his observations culminated in Geologische Beobachtungen….

300 - 500 €

Russie

83
DE TCHIHATCHEFF, Pierre.

Essai d'une carte générale de l'Altaï…

geological map
(Paris), J. Rigo, 1845. 1000 x 855 mm.Folding map mounted on linen in 16 sections, lithographed in color. Title label pasted onto the map: "De Tchihatcheff – Voyage Scientifique dans l’Altaï Oriental – Carte". Paper slightly yellowed.

The map accompanied the work published in 1845, Voyage scientifique dans l’Altaï oriental et les parties adjacentes des frontières de Chine… by Pierre de Tchihatcheff, with a report on the geological section of the work by Messrs. A. Brongniart, Dufrénoy, and Élie deBeaumont. In 1842, Tchihatcheff took part in an expedition to the Altai Mountains to study their geography and geology. He discovered the sources of the Abakan, Chu, and Chulyshman rivers, crossed the previously unexplored southern Altai, and traveled through the Sayan Mountains, while observing the tribal customs of the region's nomadic and sedentary peoples. The results of this journey were published in French in Paris in 1845 under the title Voyage scientifique dans l’Altaï oriental et les parties adjacentes de la frontière de Chine, by Pierre de Tchihatcheff. In this work, he presented the findings of his expeditions concerning the most important coal basin of the Donetsk region, the Kuznetsk Basin. Thanks to his observations, geological maps and precise surveys of the area were produced. The Chikhachyov Mountains (Monts Tchikhatchov), which he explored, were later named in his honor. Piotr Alexandrovich Tchikhatchov, or Piotr Tchihatcheff, was born on August 28 (August 16, Old Style), 1808, in Gatchina, and died on October 13, 1890, in Florence. He was a Russian geographer, geologist, and explorer who wrote in French. His name was given to the Chikhachyov Mountains in the Altai.

500 - 700 €

Danemark

84
PUGGAARD, Christopher.

Stevns Klint / Möens Klint.

geological map
Copenhague, 1851. x mm.2 color engraved plates mounted on canvas : 48 x 64 cm and 47 x 62 cm. Slight water staining.

Christopher Puggaard (or Hans Christopher Wilhelm Puggaard, born on 23 May 1823 in Copenhagen, and died on 14 August 1864 in Caen, Normandy) was a Danish geologist. In 1851, Puggaard published his book on the geology of the Island of Møn (Möens Geologie. Populært fremstillet. Tillige som Veiviser for Besögende af Möens Klint) in Danish, which was awarded the University of Copenhagen's gold medal.

100 - 200 €

Norvège

85
GEOGRAFISKE OPMAALING / KJERULF, Theodor .

Udsigt over det sydlige Norges Geologi. Atlas.

geological map
Christiania, Steensballes Boghandel, 1879. x mm.Oblong 4to. With 39 plates and one folding chromolithographed map mounted on linen, inserted at the end (82 × 58 cm). The cover has been replaced with kraft paper bearing a pasted title label.

Geological atlas of southern Norway. Official publication providing an overview of the geology of the southern part of Norway (without the accompanying text).

300 - 500 €

France générale

86
MINISTÈRE DES TRAVAUX PUBLICS.

Carte géologique de la France (Atlas).

geological map
Paris, Imprimerie Nationale, 1873. x mm.


1000 - 1500 €

France générale

87
PELET, L.t. G.al.

Carte topographique de la France.

geological map
Dépôt de la Guerre, 1832-1880. 640 x 510 mm.


1000 - 1500 €

France générale

88
COMITÉ NATIONAL DE GÉOGRAPHIE.

Atlas de France (Métropole).

geological map
Paris, Éditions géographiques de France, 1958. x mm.


100 - 200 €

Savoie

89
SABATIER, L./ HOGARD.

[Glaciers]. Mont Blanc…

geological map
Strasbourg, E. Simon / L. Sabatier, ca. 1850. x mm.


300 - 500 €


Please contact Béatrice Loeb-Larocque for the lots offered in this sale.
Bids can be placed online using the DrouotLive or Interencheres.com platforms.


Béatrice Loeb-Larocque Expert
Member of SFEP (Syndicat Français des Experts Professionnels en Oeuvres d'Art)
Tel.: +33 1 84884586 / +33 6 11 80 33 75
Email : info@loeb-larocque.com


Valuation
We provide a free appraisal if you are considering selling one of your maps, atlases, or books. We valuate books, maps and atlases
Please use the valuation form or send us a description and picture of the title page.

Estimates are free of charge if you want to sell your item.